雅思小作文饼状图.doc
《雅思小作文饼状图.doc》由会员分享,可在线阅读,更多相关《雅思小作文饼状图.doc(2页珍藏版)》请在冰豆网上搜索。
Youshouldspendabout20minutesonthistask.Writeareportforauniversitylecturerdescribingtheinformationshownbelow.Youshouldwriteatleast150words.
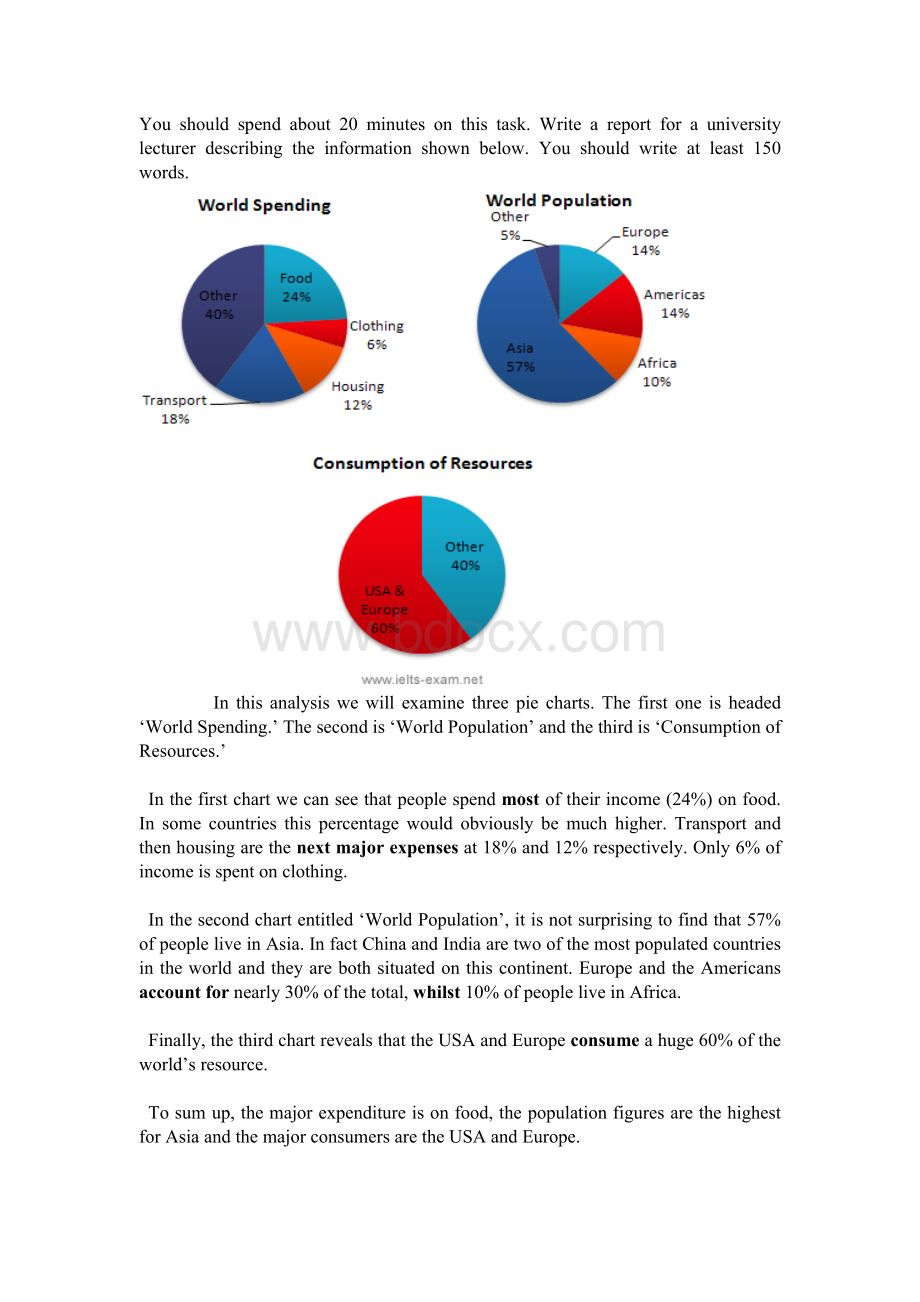
Inthisanalysiswewillexaminethreepiecharts.Thefirstoneisheaded‘WorldSpending.’Thesecondis‘WorldPopulation’andthethirdis‘ConsumptionofResources.’
Inthefirstchartwecanseethatpeoplespendmostoftheirincome(24%)onfood.Insomecountriesthispercentagewouldobviouslybemuchhigher.Transportandthenhousingarethenextmajorexpensesat18%and12%respectively.Only6%ofincomeisspentonclothing.
Inthesecondchartentitled‘WorldPopulation’,itisnotsurprisingtofindthat57%ofpeopleliveinAsia.InfactChinaandIndiaaretwoofthemostpopulatedcountriesintheworldandtheyarebothsituatedonthiscontinent.EuropeandtheAmericansaccountfornearly30%ofthetotal,whilst10%ofpeopleliveinAfrica.
Finally,thethirdchartrevealsthattheUSAandEuropeconsumeahuge60%oftheworld’sresource.
Tosumup,themajorexpenditureisonfood,thepopulationfiguresarethehighestforAsiaandthemajorconsumersaretheUSAandEurope.
ThetwographsshowthatoilwasthemajorenergysourceintheUSAinboth1980and1990.
Itismanifestfromthepiechartsthatcoal,naturalgasandhydroelectricpowerremainedinmuchthesameproportions.Ontheotherhand,therewasadramaticriseinnuclearpower,whichdoubleditspercentageoverthetenyears.
Oilsuppliedthelargestpercentageofenergy,althoughthepercentagedecreasedfrom42%in1980to33%in1990.Coalin1990wasthesecondlargestsourceofenergy,increasingitsproportionto27%from22%inthepreviousdecade.Naturalgas,thesecondlargestsourcein1980at26%,decreaseditsshareveryslightlytoprovide25%ofAmerica’senergytenyearslater.Therewasnochangeinthepercentagesuppliedbyhydroelectricpowerwhichremainedat5%ofthetotalenergyused.Nuclearpowerthegreatestchange:
in1990itwas10%,twicethatofthe1980s.
占…比例:
Occupyaccountfortakepartin
剑4P54剑8P53剑8p3剑7p101
 升级会员
升级会员 