层流管道Word文件下载.docx
《层流管道Word文件下载.docx》由会员分享,可在线阅读,更多相关《层流管道Word文件下载.docx(12页珍藏版)》请在冰豆网上搜索。
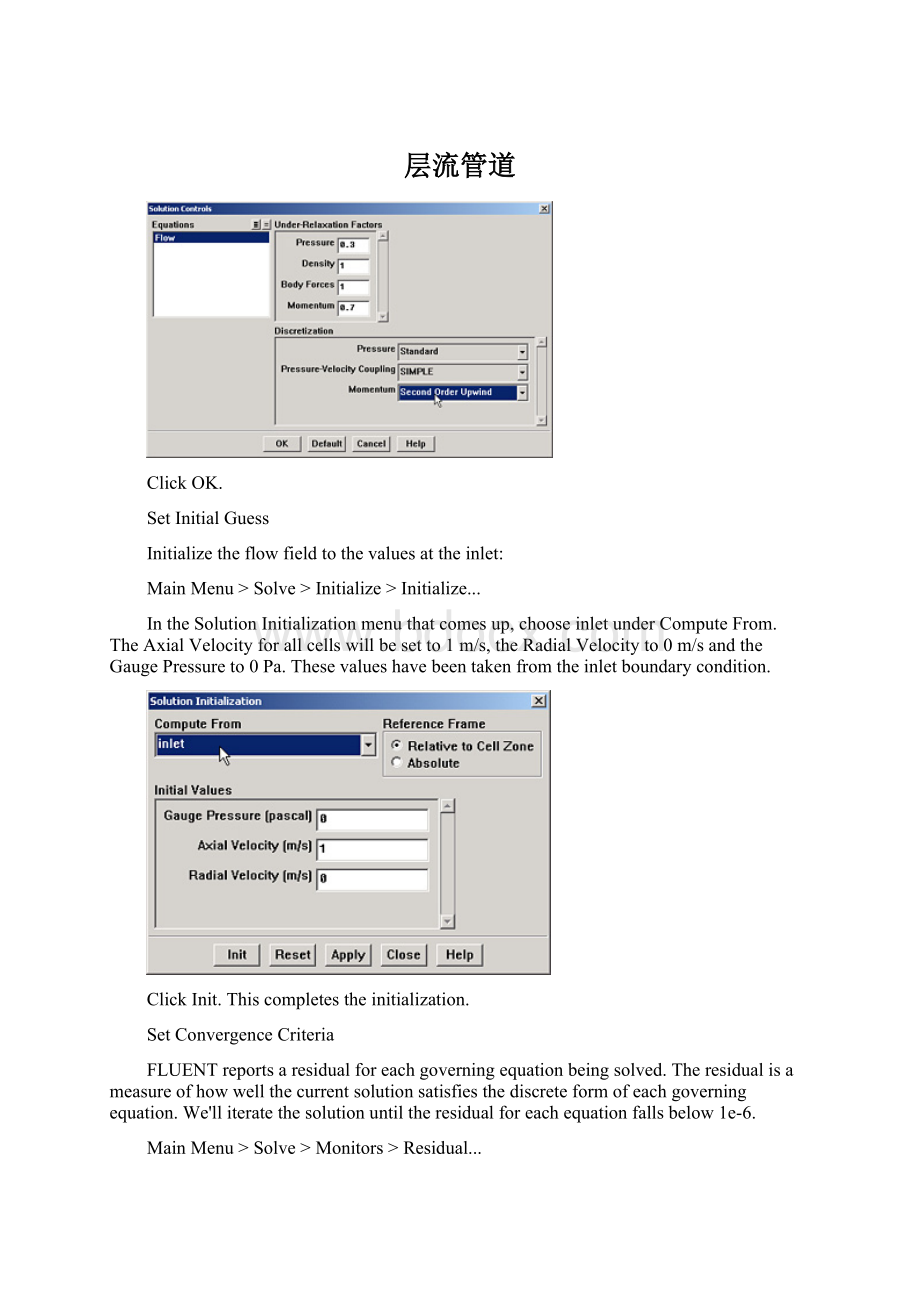
ClickInit.Thiscompletestheinitialization.
SetConvergenceCriteria
FLUENTreportsaresidualforeachgoverningequationbeingsolved.Theresidualisameasureofhowwellthecurrentsolutionsatisfiesthediscreteformofeachgoverningequation.We'
lliteratethesolutionuntiltheresidualforeachequationfallsbelow1e-6.
Monitors>
Residual...
ChangetheresidualunderConvergenceCriterionforcontinuity,x-velocity,andy-velocity,allto1e-6.
Also,underOptions,selectPlot.Thiswillplottheresidualsinthegraphicswindowastheyarecalculated.
Thiscompletestheproblemspecification.Saveyourwork:
File>
Write>
Case...
Typeinpipe.casforCaseFile.ClickOK.Checkthatthefilehasbeencreatedinyourworkingdirectory.IfyouexitFLUENTnow,youcanretrieveallyourworkatanytimebyreadinginthiscasefile.
IterateUntilConvergence
Startthecalculationbyrunning100iterations:
Iterate...
IntheIterateWindowthatcomesup,changetheNumberofIterationsto100.ClickIterate.
Theresidualsforeachiterationisprintedoutaswellasplottedinthegraphicswindowastheyarecalculated.
(Clickpictureforlargerimage)
Theresidualsfallbelowthespecifiedconvergencecriterionof1e-6in46iterations.
Savethesolutiontoadatafile:
Data...
Enterpipe.datforDataFileandclickOK.Checkthatthefilehasbeencreatedinyourworkingdirectory.Youcanretrievethecurrentsolutionfromthisdatafileatanytime.
GotoStep6:
AnalyzeResults
Step6:
AnalyzeResults
CenterlineVelocity
We'
llplotthevariationoftheaxialvelocityalongthecenterline.
Plot>
XYPlot...
MakesurethatPositiononXAxisissetunderOptions,andXissetto1andYto0underPlotDirection.ThistellsFLUENTtoplotthex-coordinatevalueontheabscissaofthegraph.
UnderYAxisFunction,pickVelocity...andthenintheboxunderthat,pickAxialVelocity.
PleasenotethatXAxisFunctionandYAxisFunctiondescribethexandyaxesofthegraph,whichshouldnotbeconfusedwiththexandydirectionsofthepipe.
Finally,selectcenterlineunderSurfacessinceweareplottingtheaxialvelocityalongthecenterline.Thisfinishessettinguptheplottingparameters.
ClickPlot.
Thisbringsupaplotoftheaxialvelocityasafunctionofthedistancealongthecenterlineofthepipe.
Inthegraphthatcomesup,wecanseethatthevelocityreachesaconstantvaluebeyondacertaindistancefromtheinlet.Thisisthefully-developedflowregion.
Changetheaxesextents:
IntheSolutionXYPlotmenu,clickonAxes....UnderOptions,deselectAutoRange.TheboxesunderRangeshouldnowbeactivated.SelectXunderAxis.Enter1forMinimumand3forMaximumunderRange.
llturnonthegridlinestohelpestimatewheretheflowbecomesfullydeveloped.ChecktheboxesnexttoMajorRulesandMinorRulesunderOptions.ClickApply.
Now,pickYunderAxisandonceagaindeselectAutoRangeunderOptions,thenenter1.8forMinimumand2.0forMaximumunderRange.AlsoselectMajorRulesandMinorRulestoturnonthegridlinesintheYdirection.Wehavenowfinishedspecifyingtherangeforeachaxes,soclickApplyandthenClose.
GobacktotheSolutionXYPlotmenuandclickPlottoreplotthegraphwiththenewaxesextents.Wecanseethatthefully-developedregionstartsataroundx=3mandthecenterlinevelocityinthisregionis1.93m/s.
SavingthePlot
Savethedatafromthisplot:
IntheSolutionXYPlotWindow,checktheWritetoFileboxunderOptions.ThePlotbuttonshouldhavechangedtoWrite....ClickonWrite....Entervel.xyastheXYFileNameandclickOK.CheckthatthisfilehasbeencreatedinyourFLUENTworkingdirectory.
Now,saveapictureoftheplot:
LeavetheSolutionXYPlotWindowandtheGraphicsWindowopenandclickon:
File>
Hardcopy...
UnderFormat,chooseoneofthefollowingthreeoptions:
EPS-ifyouhaveapostscriptviewer,thisisthebestchoice.EPSallowsyoutosavethefileinvectormode,whichwillofferthebestviewableimagequality.AfterselectingEPS,chooseVectorfromunderFileType.
TIFF-thiswillofferahighresolutionimageofyourgraph.However,theimagefilegeneratedwillberatherlarge,sothisisnotrecommendedifyoudonothavealotofroomonyourstoragedevice.
JPG-thisissmallinsizeandviewablefromallbrowsers.However,thequalityoftheimageisnotparticularlygood.
Afterselectingyourdesiredimageformatandassociatedoptions,clickonSave...
Entervel.eps,vel.tif,orvel.jpgdependingonyourformatchoiceandclickOK.
Verifythattheimagefilehasbeencreatedinyourworkingdirectory.Youcannowcopythisfileontoadiskorprintitoutforyourrecords.
CoefficientofSkinFriction
FLUENTprovidesalargeamountofusefulinformationintheonlinehelpthatcomeswiththesoftware.Let'
sprobetheonlinehelpforinformationoncalculatingthecoefficientofskinfriction.
Help>
User'
sGuideIndex...
ClickonSinthelinksontopandscrolldowntoskinfrictioncoefficient.Clickonthesecond965link(normally,youwouldhavetogothrougheachofthelinksuntilyoufindwhatyouarelookingfor).Wecanseeanexcerptontheskincoefficientaswellastheequationforcalculatingit.
ClickonthelinkforReferenceValuespanel,whichtellsushowtosetthereferencevaluesusedincalculatingtheskincoefficient.
Setthereferencevalues:
Report>
ReferenceValues...
SelectinletunderComputeFromtotellFLUENTtocalculatethereferencevaluesfromthevaluesatinlet.Checkthatdensityis1kg/m3andvelocityis1m/s.(Alternately,youcouldhavejusttypedintheappropriatevalues).ClickOK.
GobacktotheSolutionXYPlotmenu.UncheckWritetoFileunderOptionssincewewanttoplottothewindowrightnow.WecanleavetheotherOptionsandPlotDirectionasissincewearestillplottingagainstthexdistancealongthepipe.
UndertheYAxisFunction,pickWallFluxes...,andthenSkinFrictionCoefficientintheboxunderthat.
UnderSurfaces,selectwallandunselectcenterlinebyclickingonthem.
Resetaxesranges:
GotoAxes...andre-selectAuto-RangefortheYaxis.SettherangeoftheXaxisfrom1to8byselectingXunderAxis,entering1underMinimum,and8underMaximumintheRangebox(remembertode-selectAuto-Rangefirstifitischecked).
ClickApply,Close,andthenPlotintheSolutionXYPlotWindow.
Wecanseethatthefullydevelopedregionisreachedataroundx=3.0mandtheskinfrictioncoefficientinthisregionisaround1.54.Comparethenumericalvalueof1.54withthetheoretical,fully-developedvalueof0.16.
PickWritetoFileunderOptionsandclickWrite....Entercf.xyforXYFileandclickOK.
VelocityProfile
llnextplotthevelocityattheoutletasafunctionofthedistancefromthecenterofthepipe.Todothis,wehavetosettheyaxisofthegraphtobetheyaxisofthepipe(theradialdirection).
Toplotthepositionvariableontheyaxisofthegraph,uncheckPositiononXAxisunderOptionsandchoosePositiononYAxisinstead.Tomakethepositionvariabletheradialdistancefromthecenterline,underPlotDirection,changeXto0andYto1.Toplottheaxialvelocityonthexaxisofthegraph,forXAxisFunction,pickVelocity...andAxialVelocityunderthat.
Sincewewanttoplotthisattheoutletboundary,pickoutletunderSurfaces.
ChangeboththexandyaxestoAuto-Range.
UncheckWritetoFileunderOptionssothatwecanseethegraph.ClickPlot.
Doesthislooklikeaparabolicprofile?
PickWritetoFileunderOptionsandclickWrite....Enterprofile.xyforXYFileandclickOK.
Toseehowthevelocityprofilechangesinthedevelopingregion,letusaddtheprofilesatx=0.6m(x/D=3)andx=0.12m(x/D=6)totheaboveplot.First,createalineatx=0.6musingtheLine/Raketool:
Surface>
Line/Rake
llcreateastraightlinefrom(x0,y0)=(0.6,0)to(x1,y1)=(0.6,0.1).SelectLineToolunderOptions.Enterx0=0.6,y0=0,x1=0.6,y1=0.1.Enterline1underNewSurfaceName.ClickCreate.
Toseethelinejustcreated,select
Display>
Grid...
Notethatline1appearsinthelistofsurfaces.Selectallsurfacesexceptdefault-interior.ClickDisplay.Thisdisplaysallsurfacesbutnotthemeshcells.Zoomintotheregionneartheinlettoseethelinecreatedatx=0.6m.(Clickheretoreviewthezoomfunctionalitydiscussioninstep4.)line1isthewhiteverticallinetotherightinthefigurebelow.
Similarly,createaverticallinecalledline2atx=1.2;
(x0,y0)=(1.2,0)to(x1,y1)=(1.2,0.1)inthiscase.Displayitinthegraphicswindowtocheckthatithasbeencreatedcorrectly.
Nowwecanplotthevelocityprofilesatx=0.6m(x/D=3)andx=0.12m(x/D=6)alongwiththeoutletprofile.IntheSolutionXYplotmenu,usethesamesettingsasabove.UnderSurfaces,inadditiontooutlet,selectline1andline2.SelectNodeValuesund
 升级会员
升级会员 