MATLAB机考样题(带答案).doc
《MATLAB机考样题(带答案).doc》由会员分享,可在线阅读,更多相关《MATLAB机考样题(带答案).doc(5页珍藏版)》请在冰豆网上搜索。
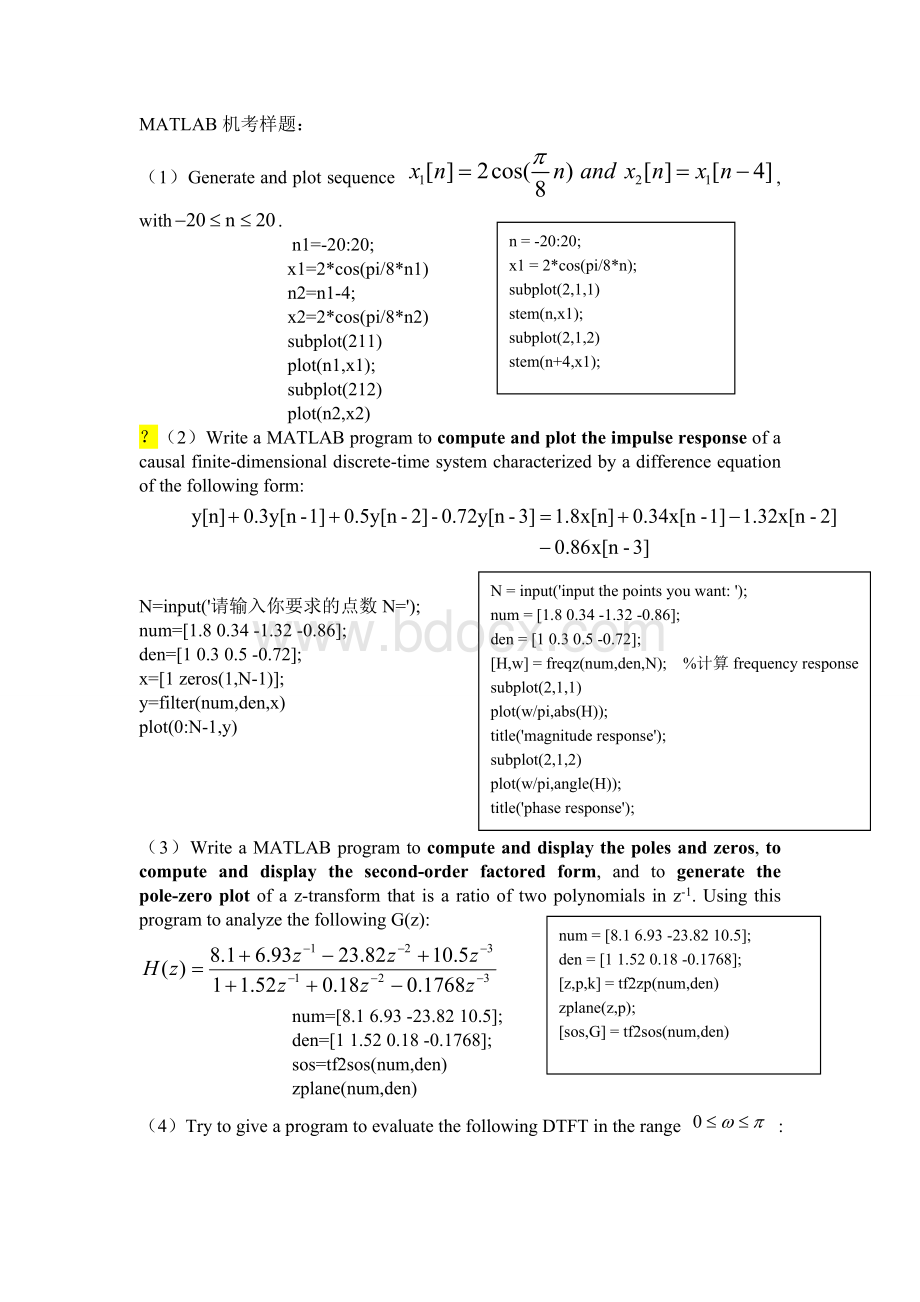
MATLAB机考样题:
n=-20:
20;
x1=2*cos(pi/8*n);
subplot(2,1,1)
stem(n,x1);
subplot(2,1,2)
stem(n+4,x1);
(1)Generateandplotsequence,with.
n1=-20:
20;
x1=2*cos(pi/8*n1)
n2=n1-4;
x2=2*cos(pi/8*n2)
subplot(211)
plot(n1,x1);
subplot(212)
plot(n2,x2)
?
(2)WriteaMATLABprogramtocomputeandplottheimpulseresponseofacausalfinite-dimensionaldiscrete-timesystemcharacterizedbyadifferenceequationofthefollowingform:
N=input('inputthepointsyouwant:
');
num=[1.80.34-1.32-0.86];
den=[10.30.5-0.72];
[H,w]=freqz(num,den,N);%计算frequencyresponse
subplot(2,1,1)
plot(w/pi,abs(H));
title('magnituderesponse');
subplot(2,1,2)
plot(w/pi,angle(H));
title('phaseresponse');
N=input('请输入你要求的点数N=');
num=[1.80.34-1.32-0.86];
den=[10.30.5-0.72];
x=[1zeros(1,N-1)];
y=filter(num,den,x)
plot(0:
N-1,y)
num=[8.16.93-23.8210.5];
den=[11.520.18-0.1768];
[z,p,k]=tf2zp(num,den)
zplane(z,p);
[sos,G]=tf2sos(num,den)
(3)WriteaMATLABprogramtocomputeanddisplaythepolesandzeros,tocomputeanddisplaythesecond-orderfactoredform,andtogeneratethepole-zeroplotofaz-transformthatisaratiooftwopolynomialsinz-1.UsingthisprogramtoanalyzethefollowingG(z):
num=[8.16.93-23.8210.5];
den=[11.520.18-0.1768];
sos=tf2sos(num,den)
zplane(num,den)
(4)TrytogiveaprogramtoevaluatethefollowingDTFTintherange:
%由于用freqz计算频点至少是2个,所以至少输入两个频点
w1=input('请输入你要计算的频点w1=');
w2=input('请输入你要计算的频点w2=');
w=[w1w2];
num=[25953];
den=[545211];
h=freqz(num,den,w)
N=input('inputthepointsyouwanttocompute:
');
num=[25953];
den=[545211];
[h,w]=freqz(num,den,N);
subplot(2,2,1)
plot(w/pi,real(h));grid
title('Realpart')
xlabel('\omega/\pi');ylabel('Amplitude')
subplot(2,2,2)
plot(w/pi,imag(h));grid
title('Imaginarypart')
xlabel('\omega/\pi');ylabel('Amplitude')
subplot(2,2,3)
plot(w/pi,abs(h));grid
title('MagnitudeSpectrum')
xlabel('\omega/\pi');ylabel('Magnitude')
subplot(2,2,4)
plot(w/pi,angle(h));grid
title('PhaseSpectrum')
xlabel('\omega/\pi');ylabel('Phase,radians')
(6)WriteaMATLABprogramtocomputeandplotthemagnituderesponseofacausalLTIdiscrete-timesystemwithatransferfunctiongivenby
num=[0.150-0.15];
den=[1-0.50.7];
[h,w]=freqz(num,den);
plot(w/pi,h)
num=0.15*[10-1];
den=[1-0.50.7];
[h,w]=freqz(num,den,512);
plot(w/pi,abs(h))
(7)ConsiderthefollowingFIRtransferfunction:
UsingMATLABtodetermineitszerolocationsandplotitsmagnitudeandphaseresponse.
h=[10.6.49-0.48-0.14-0.120.09];
figure
(1)
zplane(h,1);
[H,w]=freqz(h,1,512);
figure
(2)
plot(w/pi,abs(H))
figure(3)
plot(w/pi,angle(H))
clear;
num=[10.60.49-0.48-0.14-0.120.09];
den=[1000000];
figure
(1)
[z,p,k]=tf2zp(num,den)%tf2zp(num,den)中num,den的长度必须相等
zplane(num,den)
[H,w]=freqz(num,den);
figure
(2)
subplot(2,1,1)
plot(w/pi,abs(H));
title('magnituderesponse');
subplot(2,1,2)
plot(w/pi,angle(H));
title('phaseresponse');
n=0:
63;
n=n/(2*10^4);
x=4*n+cos(0.1*pi*n);
[H,w]=freqz(x,1);
subplot(2,1,1)
plot(w/pi,abs(H));
title('magnitudespectrum');
subplot(2,1,2)
plot(w/pi,angle(H));
title('phasespectrum');
(8)Givenasignal,whenusingasamplingfrequencyfT=20KHz,plotthemagnitudeandphasespectrumofthesampledsequence(givenlength-64).
fs=2e4;
n=(0:
63)/fs;
x=4*n+cos(0.1*pi*n);
h=fft(x,512);
figure
(1)
plot(0:
2/511:
2,abs(h))
figure
(2)
plot(0:
2/511:
2,angle(h))
(9)designanIIRbutterworthdigitallowpassfilterwiththefollowingspecifications:
samplingrateof40kHz,passbandedgefrequencyof4kHz,stopbandedgefrequencyof8kHz,passbandrippleof0.5dB,andaminimumstopbandattenuationof40dB,plotfrequency-magnitudeandcheckifyourdesignfitsthespecification.
fs=40;
wp=4*2/fs;
ws=8*2/fs;
ap=0.5;
as=40;
Ft=40000;
Fp=4000;
Fs=8000;
deltap=0.5;
deltas=40;
wp=2*Fp/Ft;
ws=2*Fs/Ft;
[N,Wn]=buttord(wp,ws,deltap,deltas);
[num,den]=butter(N,Wn);
[H,w]=freqz(num,den);
plot(w/pi,20*log10(abs(H)));
title('gainresponse');
[n,wn]=buttord(wp,ws,ap,as);
[num,den]=butter(n,wn);
[h,w]=freqz(num,den,512);
figure
(1)
plot(w/pi,20*log10(abs(h)))
axis([01-500])
figure
(2)
subplot(211)
plot(w/pi,20*log10(abs(h)))
axis([0wp-0.50]);
title('通带纹波')
subplot(212)
plot(w/pi,20*log10(abs(h)))
axis([ws1-50-30])
title('阻带纹波')
(10)DesignaHanningFIRlowpassfiltermeetingthefollowingspecifications:
passbandedgefrequency=2kHz,stopbandedgefrequency=2.5kHz,passbandrippleδp=0.005,stopbandrippleδs=0.005,andsamplingrateof10kHz.Plotitsgainandphaseresponsesandcheckifitmeetsthespecifications?
ft=10;
fp=2;
Wp=2/10*pi;Ws=2.5/10*pi;
dw=abs(Wp-Ws);
ds=0.005;
ap=20*log10(1-ds)
as=20*log10(ds)
M=3.11*pi/dw;
N=ceil(2*M+1);
Wc=(Wp+W
 升级会员
升级会员 