专题复习表格图表复习.docx
《专题复习表格图表复习.docx》由会员分享,可在线阅读,更多相关《专题复习表格图表复习.docx(24页珍藏版)》请在冰豆网上搜索。
专题复习表格图表复习
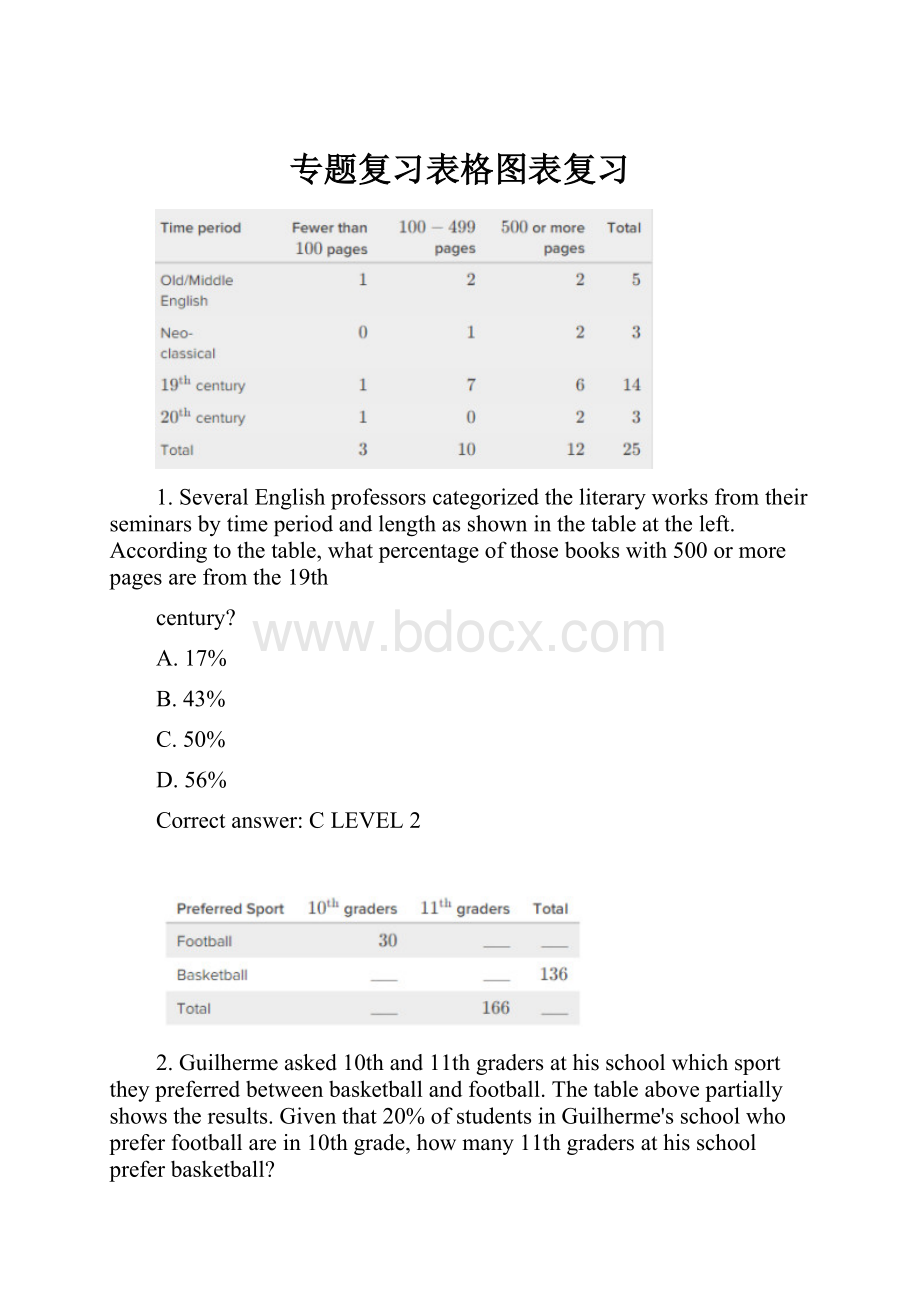
1.SeveralEnglishprofessorscategorizedtheliteraryworksfromtheirseminarsbytimeperiodandlengthasshowninthetableattheleft.Accordingtothetable,whatpercentageofthosebookswith 500 ormorepagesarefromthe 19th
century?
A.17%
B.43%
C.50%
D.56%
Correctanswer:
CLEVEL2
2.Guilhermeasked 10th and 11th gradersathisschoolwhichsporttheypreferredbetweenbasketballandfootball.Thetableabovepartiallyshowstheresults.Giventhat 20% ofstudentsinGuilherme'sschoolwhopreferfootballarein 10th grade,howmany 11th gradersathisschoolpreferbasketball?
A.27
B.46
C.120
D.150
Correctanswer:
BLEVEL2
3.Asciencetextbookhasfourchapters,eachwithanumberofskillsproblemsandofanalysisproblems.Atablerepresentingthisinformationisontheleft.Basedonthetable,whichofthefollowingstatementsistrue?
A.Therelativefrequencyofanalysisproblemscomingfromchapter 4 is
.
B.Therelativefrequencyofanalysisproblemscomingfromchapter 2 is
.
C.Therelativefrequencyofproblemsinchapter 1 beingskillsproblemsis
.
D.Therelativefrequencyofproblemsinchapter 2 beingskillsproblemsis
.
Correctanswer:
ALEVEL2
4.Victordecidestotrythreedifferentroutestoworkforaperiodof 40 days.Inthetableabove,hetrackedwhetherhearrivedtoworklateorontimeeachtimethatheusedaparticularroute.Accordingtothetable,whatistheprobabilitythatVictorwaslatewhenheusedRouteA?
A.
B.
C.
D.
Correctanswer:
DLEVEL2
5.Abiologyprofessorisinvestigatingtrendsincurrentenrollmentofmale/femaleundergraduatestudentsincertainbiologicallyfocusedcross-departmentalprograms.Theabovetablerepresentstheprofessor'sfindings.Notethatstudentsarenotallowedtoenrollinmorethanoneoftheseprogramsatthisparticularschool.Abouthowmanyfemalestudentsshouldbeenrolledintheforensicsprogramtoprovideevidencethatenrollinginforensicsisindependentofstudentgender?
A.66
B.118
C.210
D.214
Correctanswer:
BLEVEL2
6.Thehousesinthe“historicdistrict”ofaparticulartownareeitherhistoricallyprotectedornot.Theabovetablepartiallyrepresentsthesehomesandwhethertheyhavefoundationsmadefrompouredconcrete,mortarandfieldstone,oracombinationofboth.Ifonly 4.5% ofthenon-historically-protectedhomeshaveafieldstone&mortarfoundation,howmanyhomesisthis?
Roundtothenearestwholenumber.
Correctanswer:
6±0.5LEVEL2
1.Geometrystudentsparticipatedinanactivitytoclassifytheshapesintheroombynumberofsidesandcolor.Thetableabovedisplaystheresults.Ifatriangleischosenatrandomfromthisactivity,whatistheprobabilitythatitisblue?
A.
B.
C.
D.
Correctanswer:
DLEVEL3
2.Agroupofrestaurantownerssurveyedalistofpeopletodeterminehowpreferencesofmeatscomparedtopreferencesofgrains,andiftheyarerelated.Theresultsareinthetableabove.Basedonthetable,isthereevidenceofassociationbetweenchickenpreferencesandricepreferences?
A.Yes,becausetheproportionofchickenandriceeaterstoallchickeneatersishigherthanallriceeaterstoalleaters;andbecausetheproportionofchickenandriceeaterstoallriceeatersishigherthanallchickeneaterstoalleaters.
B.Yes,becausetheproportionofchickenandriceeaterstoallriceeatersishigherthanallriceeaterstoalleaters;andbecausetheproportionofchickenandriceeaterstoallriceeatersishigherthanallriceeaterstoalleaters.
C.No,becausetheproportionofchickenandriceeaterstoallchickeneatersislowerthanallriceeaterstoalleaters;andbecausetheproportionofchickenandriceeaterstoallriceeatersislowerthanallchickeneaterstoalleaters.
D.No,becausetheproportionofchickenandriceeaterstoallchickeneatersislowerthanallchickeneaterstoalleaters;andbecausetheproportionofchickenandriceeaterstoallriceeatersislowerthanallriceeaterstoalleaters.
Correctanswer:
ALEVEL3
3.Asurveyconductedonarandomsamplereportsfindingsontelecommutinginnon-academicjobsintheUnitedStates,withafocusonsalesandcomputerprogramming.Accordingtothetableabove,whatistheprobabilitythatarandomlychosenjobfromthestudyisapartiallyremotesalesjob?
Roundtothenearesthundredth.
Correctanswer:
0.12LEVEL3
4.AmanufacturerofplasticsandepoxyresinshascommittedtoeliminatingthechemicalBisphenol-A(BPA)fromitsentireproductline.Accordingtothetable,whatpercentageofthemanufacturer'sepoxyresinandpolycarbonateproductsareBPA-containingpolycarbonateproducts?
Roundanswertothenearesttenthofapercent.
Correctanswer:
51.7±0.1LEVEL3
5.StudentsinacollegegeographyclasscreatedatableinwhichthecountriesofNorthandCentralAmericaaredisplayedbybothpopulationandpopulationdensity(persquarekilometer).IftherelativefrequencyofthisoccurringcomparedwithallcountriesinNorthAmericais 0.174,howmanycountrieshaveapopulationdensityoffewerthan 100
andhaveamediumpopulation?
A.2
B.4
C.17
D.63
Correctanswer:
BLEVEL3
1.Thetableontheleftshowsthemostcommonlyspokenfivelanguagesintheworldbynativeandnon-nativespeakers,inmillions,accordingtothe2013 SILEthnologue.IftherelativefrequencyofSpanishnon-nativespeakerstoallnon-nativespeakerswas 4.8%,approximatelyhowmanynon-nativeSpanishspeakers,inmillions,weretherein2013?
A.20
B.59
C.119
D.594
Correctanswer:
BLEVEL4
2.Donteandhisfriendsorderedpizzaforabirthdayparty.Theyaskedalltheguestsatthepartywhethertheywantedsauceornosauceandwhethertheywantedcheeseornocheese.Theresultsaredisplayedinthetableabove.Dontefoundthat 1/5 ofthepeoplewhowantedcheesedidnotwantsauce.Whatfractionofthepeoplewhowantedsaucealsowantedcheese?
A.1/9
B.8/13
C.4/5
D.8/9
Correctanswer:
DLEVEL4
3.AnEnglishprofessorclassifiedthenovelsinhisBritishLiteraturesyllabusbycenturywrittenandlengthofthenovel.Someoftheresultsareinthetableabove.Basedonthetable,howmanybooks,bothfrom 20th centurythatare 200 pagesandabove,couldtherebeintheclasstosuggestevidenceofassociation?
Books
Correctanswer:
12LEVEL4
1.Thescatterplottotheleftshowsthenumberofsmartphonesolds, N,inmillions,atacertaincompanyfrom 2008 to 2012,where t representsyearssince 2008.Whichofthefollowingbestmodelstherelationshipbetween N and t?
A.N=15
B.N=15
C.N=11.68
D.N=11.68
Correctanswer:
CLEVEL4
2.Thescatterplotatleftshowstheworldpopulationbetweentheyears1950 and 2013.Afunctionthatmodelsthedatashownis:
f(x)=0.07x+2.34
where x representsthenumberofyearssince 1950,and f(x)representstheworldpopulationinbillionsofpeople.Accordingtothismodel,whatwastheapproximateworldpopulationintheyear 1981?
A.5.2 billionpeople
B.2.34 billionpeople
C.1,252.29 billionpeople
D.8.64 billionpeople
Correctanswer:
DLEVEL4
3.Thescatterplottotheleftshowsthepercent, P,ofAmericansthatreportedaccessingtheInternetathomeviadial-upInternetservice.If trepresentstheyearssince 2005,whichofthefollowingexponentialequationsbestmodelsthetrendinthepercentofdial-upusersfrom2005 to 2012?
A.P=30
B.P=30t
C.P=−30
D.P=−30
Correctanswer:
ALEVEL4
4.Thescatterplotdrawnatleftdepictsthechangeinprimelendingrates(interestrates)ofUnitedStates(U.S.)majorbanksfrom 2004 to 2009.Whichofthefollowingfunctionsbestdescribestherelationshipshown?
A.y=4.02
B.y=−4.02
C.y=−0.65
+3.74x+3.17
D.y=0.65
+3.74x+3.17
Correctanswer:
CLEVEL4
5.Thescatterplotdrawnatleftdepictsthechangeinprimelendingrates(interestrates)ofUnitedStates(U.S.)majorbanksfrom 2004 to 2009.Whichofthefollowingfunctionsbestdescribestherelationshipshown?
A.y=−0.65
−3.74x+3.17
B.y=0.65
−3.74x+3.17
C.y=−0.65
+3.74x+3.17
D.y=0.65
+3.74x+3.17
Correctanswer:
CLEVEL4
6.ThescatterplotatleftshowsthepopulationofSt.Louis,Missourifrom1950 to 2010.Basedonthelineofbestfittothedatashown,whichofthefollowingvaluesisclosesttotheaverageyearlychangeinthepopulationofSt.Louis,Missouri?
A.−9.3 thousand
B.−93.3 thousand
C.−0.11 thousand
D.−0.93 thousand
Correctanswer:
ALEVEL4
7.Thescatterplottotheleftshowsthenumberofteams, t,thatplayinround r ofabasketballtournament.Forintegervaluesof r,where1≤r≤6,whichofthefollowingequationsbestmodelsthedata?
A.t=96−32r
B.t=64−16r
C.t=128
D.t=128
Correctanswer:
CLEVEL4
8.AtravelagentincludedthescatterplottotheleftinaninformationalbrochureonHawaii'sBigIsland.Abestfitcurveisshownonthegraph,where r representstheBigIsland'saveragerainfall,ininches(in),andm representsthemonthoftheyear,withm=1 correspondingtoJanuary,m=2 correspondingtoFebruary,andsoon.WhichofthefollowingbestapproximatesthedifferenceinwhatthemodelpredictsforApril'saveragerainfallandwhatthestatisticsshowsforApril'saveragerainfall?
(Note:
Aprilisthe4th monthoftheyear.)
A.0 in
B.0.25 in
C.0.60 in
D.0.85 in
Correctanswer:
BLEVEL4
Aballwasdroppedfromaninitialheightof 55 feet(ft).Amotiondetectorrecordedthemaximumheight, h,infeet,oftheballafterthenth bounce.Theresultsareshowninthescatterplo
 升级会员
升级会员 