信号的频谱分析实验报告.docx
《信号的频谱分析实验报告.docx》由会员分享,可在线阅读,更多相关《信号的频谱分析实验报告.docx(24页珍藏版)》请在冰豆网上搜索。

信号的频谱分析实验报告
实验四信号的频谱分析
一.实验目的
1.掌握利用FFT分析连续周期,非周期信号的频谱,如周期,非周期方波,正弦信号等。
理解CFS,CTFT与DFT〔FFT〕的关系。
2.利用FFT分析离散周期,非周期信号的频谱,如周期,非周期方波,正弦信号等。
理解DFS,DTFT与DFT〔FFT〕的关系,并讨论连续信号与离散信号频谱分析方法的异同。
二.实验要求
1.编写程序完成任意信号数字谱分析算法;
2.编写实验报告。
三.实验内容
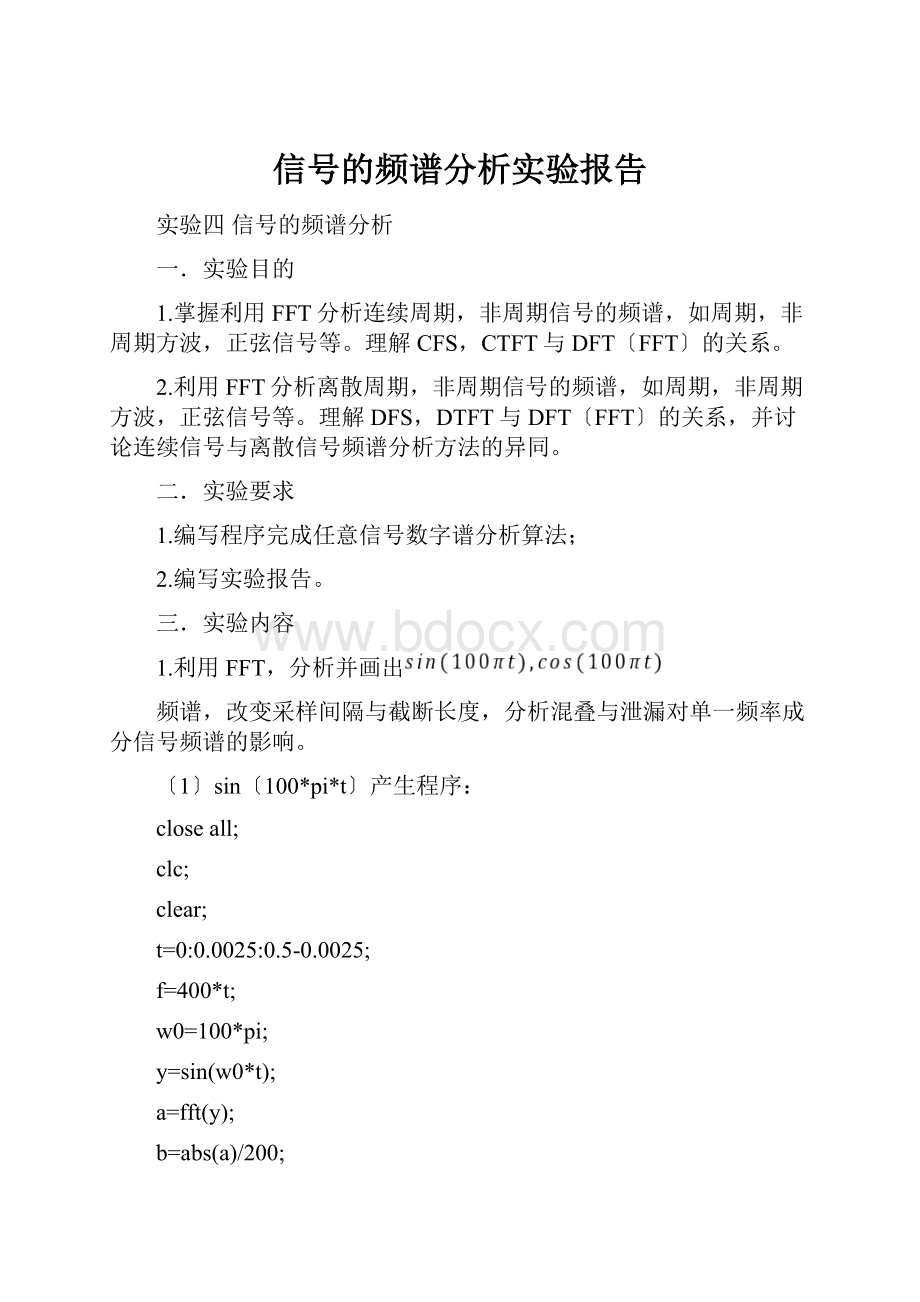
1.利用FFT,分析并画出
频谱,改变采样间隔与截断长度,分析混叠与泄漏对单一频率成分信号频谱的影响。
〔1〕sin〔100*pi*t〕产生程序:
closeall;
clc;
clear;
t=0:
0.0025:
0.5-0.0025;
f=400*t;
w0=100*pi;
y=sin(w0*t);
a=fft(y);
b=abs(a)/200;
d=angle(a)*180/pi;
subplot(311);
plot(t,y);
title('y=sin(wt)');
xlabel('t');
ylabel('y(t)');
subplot(312);
stem(f,b);
title('振幅');
xlabel('f');
ylabel('y(t)');
subplot(313);
stem(f,d);
title('相位');
xlabel('t');
ylabel('y(t)');
混叠
closeall;
clc;
clear;
t=0:
0.0115:
0.46-0.0115;
f=(t/0.0115)*2;
w0=100*pi;
y=sin(w0*t);
a=fft(y);
b=abs(a)/40;
d=angle(a)*180/pi;
subplot(311);
plot(t,y);
title('y=sin(wt)');
xlabel('t');
ylabel('y(t)');
subplot(312);
stem(f,b);
title('振幅');
xlabel('f');
ylabel('y(t)');
subplot(313);
stem(f,d);
title('相位');
xlabel('t');
ylabel('y(t)');
泄漏
closeall;
clc;
clear;
:
0.5-0.0075;
f=800*t;
w0=100*pi;
y=sin(w0*t);
a=fft(y);
b=abs(a)/198;
d=angle(a)*180/pi;
subplot(311);
plot(t,y);
title('y=sin(wt)');
xlabel('t');
ylabel('y(t)');
subplot(312);
stem(f,b);
title('振幅');
xlabel('f');
ylabel('y(t)');
subplot(313);
stem(f,d);
title('相位');
xlabel('t');
ylabel('y(t)');
〔2〕cos(100*pi*t);
closeall;
clc;
clear;
t=0:
0.0025:
0.5-0.0025;
f=800*t;
w0=100*pi;
y=cos(w0*t);
a=fft(y);
b=abs(a)/200;
d=angle(a)*180/pi;
subplot(311);
plot(t,y);
title('y=cos(wt)');
xlabel('t');
ylabel('y(t)');
gridon;
holdon;
subplot(312);
stem(f,b);
title('振幅');
xlabel('f');
ylabel('y(t)');
gridon;
holdon;
subplot(313);
stem(f,d);
title('相位');
xlabel('f');
ylabel('y(t)');
混叠
closeall;
clc;
clear;
t=0:
0.0115:
0.46-0.0115;
f=(t/0.0115)*2;
w0=100*pi;
y=cos(w0*t);
a=fft(y);
b=abs(a)/40;
d=angle(a)*180/pi;
subplot(311);
plot(t,y);
title('y=cos(wt)');
xlabel('t');
ylabel('y(t)');
subplot(312);
stem(f,b);
title('振幅');
xlabel('f');
ylabel('y(t)');
subplot(313);
stem(f,d);
title('相位');
xlabel('t');
ylabel('y(t)');
泄漏
closeall;
clc;
clear;
t=0:
0.0025:
0.5-0.0075;
f=800*t;
w0=100*pi;
y=cos(w0*t);
a=fft(y);
b=abs(a)/198;
d=angle(a)*180/pi;
subplot(311);
plot(t,y);
title('y=cos(wt)');
xlabel('t');
ylabel('y(t)');
subplot(312);
stem(f,b);
title('振幅');
xlabel('f');
ylabel('y(t)');
subplot(313);
stem(f,d);
title('相位');
xlabel('t');
ylabel('y(t)');
2.利用FFT,分析并比照方波以及半波对称的正负方波的频谱,改变采样间隔与截断长度,分析混叠与泄漏对信号频谱的影响。
方波正常
closeall;
clc;
clear;
t=0:
0.05:
5-0.05;
f=40*t;
w0=2*pi;
x=square(w0*t)+1;
subplot(311);
stem(t,x);
p=fft(x);
q=abs(p)/100;
subplot(312);
stem(f,q);
title('幅频特性曲线');
s=angle(p)*180/pi;
subplot(313);
stem(f,s);
title('相频特性曲线');
gridon;
holdon;
方波混叠
closeall
clear
clc
t=0:
0.011:
0.22-0.011;
f=(t/0.011)*2;
w0=100*pi
x=square(w0*t)
subplot(311)
stem(t,x)
p=fft(x)
q=abs(p)/20
subplot(312)
stem(f,q)
s=angle(p)*180/pi
subplot(313)
stem(t,s)
方波泄漏
closeall;
clc;
clear;
t=0:
0.05:
5-0.25;
f=40*t;
w0=2*pi;
x=square(w0*t)+1;
subplot(311);
stem(t,x);
p=fft(x);
p1=fftshift(p);
q=abs(p1)/96;
subplot(312);
stem(f,q);
title('幅频特性曲线');
s=angle(p)*180/pi;
subplot(313);
stem(f,s);
title('相频特性曲线');
gridon;
holdon;
半波相对称正常
closeall;
clc;
clear;
t=0:
0.1:
10-0.1;
f=20*t;
w0=2*pi;
x=square(w0*t);
subplot(311);
stem(t,x);
p=fft(x);
a=0:
0.1:
9.9;
q=abs(p)/100;
subplot(312);
stem(f,q);
title('幅频特性曲线');
s=angle(p)*180/pi;
subplot(313);
stem(f,s);
title('相频特性曲线');
gridon;
holdon;
半波相对称混叠
closeall;
clc;
clear;
t=0:
0.4:
10-0.4;
f=5*t;
w0=2*pi;
x=square(w0*t)+1;
subplot(311);
stem(t,x);
p=fft(x);
q=abs(p)/25;
subplot(312);
stem(f,q);
title('幅频特性曲线');
s=angle(p)*180/pi;
subplot(313);
stem(f,s);
title('相频特性曲线');
gridon;
holdon;
半波相对称泄漏
closeall;
clc;
clear;
t=0:
0.1:
10-0.5;
f=20*t;
w0=2*pi;
x=square(w0*t);
subplot(311);
stem(t,x);
p=fft(x);
q=abs(p)/95;
subplot(312);
stem(f,q);
title('幅频特性曲线');
s=angle(p)*180/pi;
subplot(313);
stem(f,s);
title('相频特性曲线');
gridon;
holdon;
3.利用FFT,分析并画出
信号的频谱,改变采样间隔与截断长度,分析混叠与泄漏对信号频谱的影响。
e-tu(t)不同Fs的影响
closeall;
clc;
clear;
t=0:
0.1:
10-0.1;
t2=0:
0.2:
20-0.2;
y2=exp(-1*t2);
y22=fft(y2);
e=abs(y22)/10;
y1=exp(-1*t);
y=fft(y1);
a=abs(y)/10;
c=angle(y)*pi/180;
h=angle(y22)*pi/180;
f=20*t;
w=2*pi*t;
x=1./(1+j*w);
b=abs(x);
d=angle(x)*pi/180;
figure
(1)
plot(f,a);
holdon;
plot(f,e,'g');
holdon;
plot(f,b,'r');
title('幅频特性比拟');
figure
(2);
plot(f,c);
holdon;
plot(f,h,'g');
holdon;
plot(f,d,'r');
title('相频特性比拟');
截断长度L对泄漏的影响
closeall;
clc;
clear;
t=0:
0.1:
10-0.1;
f=20*t;
y1=exp(-1*t);
y=fft(y1);
a=abs(y)/500;
b=abs(y)/100;
plot(f,a);
holdon;
plot(f,b,'r');
title('截断长度对泄漏的影响');
4.利用不同窗函数对内容3.中的信号进行加窗处理,分析对信号频谱的影响;
clearall;
clc;
clear;
t=0:
0.01:
5-0.01;
f=200*t;
x=exp(-t);
w_ham=(hamming(1000))';
w1=w_ham(501:
1000);
x_ham=x.*w1;
y1=fft(x_ham);
y4=fftshift(y1);
a=abs(y4);
a2=[a(251:
500),zeros(1,250)];
w_han=(hanning(1000))';
w2=w_han(501:
1000);
x_han=x.*w2;
y2=fft(x_han);
y3=fftshift(y2);
b=abs(y3);
b2=[b(251:
500),zeros(1,250)];
w_ju=[ones(1,500)];
x_ju=x.*w_ju;
y5=fft(x_ju);
y6=fftshift(y5);
c=abs(y6);
c2=[c(251:
500),zeros(1,250)];
subplot(211);
plot(t,x_ham);
holdon;
plot(t,x_han,'r');
holdon;
plot(t,x_ju,'g');
title('加窗后');
subplot(212);
plot(f,a2);
holdon;
plot(f,b2,'r');
holdon;
plot(f,c2,'g');
title('幅频特性比拟');
axis([0,200,0,100]);
5.利用FFT计算线性卷积,验证‘实验三’中时域结果的正确性。
验证卷积——方波
closeall;
clear;
clc;
t=0:
0.1:
0.9;
k=-9:
9;
f=k*10/19;
x0=rectpuls(t-0.5,1);
y=conv(x0,x0);
m=(length(y)-1)/10;
n=0:
0.1:
m;
x1=fft(x0,19);
x2=fftshift(x1);
x3=abs(x2);
z=x1.*x1;
z1=ifft(z);
z2=abs(z1);
subplot(221);
stem(t,x0);
title('方波信号');
subplot(222);
stem(y);
title('conv卷积');
subplot(223);
plot(f,x3);
subplot(224);
stem(z2);
title('验证卷积');
验证卷积——e指数
clear;
clc;
t=0:
0.1:
0.9;
x0=rectpuls(t-0.5,1);
a=exp(-2*t).*(t>=0);
y=conv(x0,a);
m=(length(y)-1);
n=0:
0.1:
m;
x1=fft(x0,19);
y1=fft(a,19);
z=x1.*y1;
z1=ifft(z);
z2=abs(z1);
subplot(221);
stem(t,x0);
title('方波信号');
subplot(222);
stem(y);
axis([0,20,0,6]);
title('conv卷积');
subplot(223);
stem(t,a);
title('e指数函数');
subplot(224);
stem(z2);
title('验证卷积');