R语言时间序列作业.docx
《R语言时间序列作业.docx》由会员分享,可在线阅读,更多相关《R语言时间序列作业.docx(13页珍藏版)》请在冰豆网上搜索。

R语言时间序列作业
2016年第二学期时间序列分析及应用R语言课后作业
第三章趋势
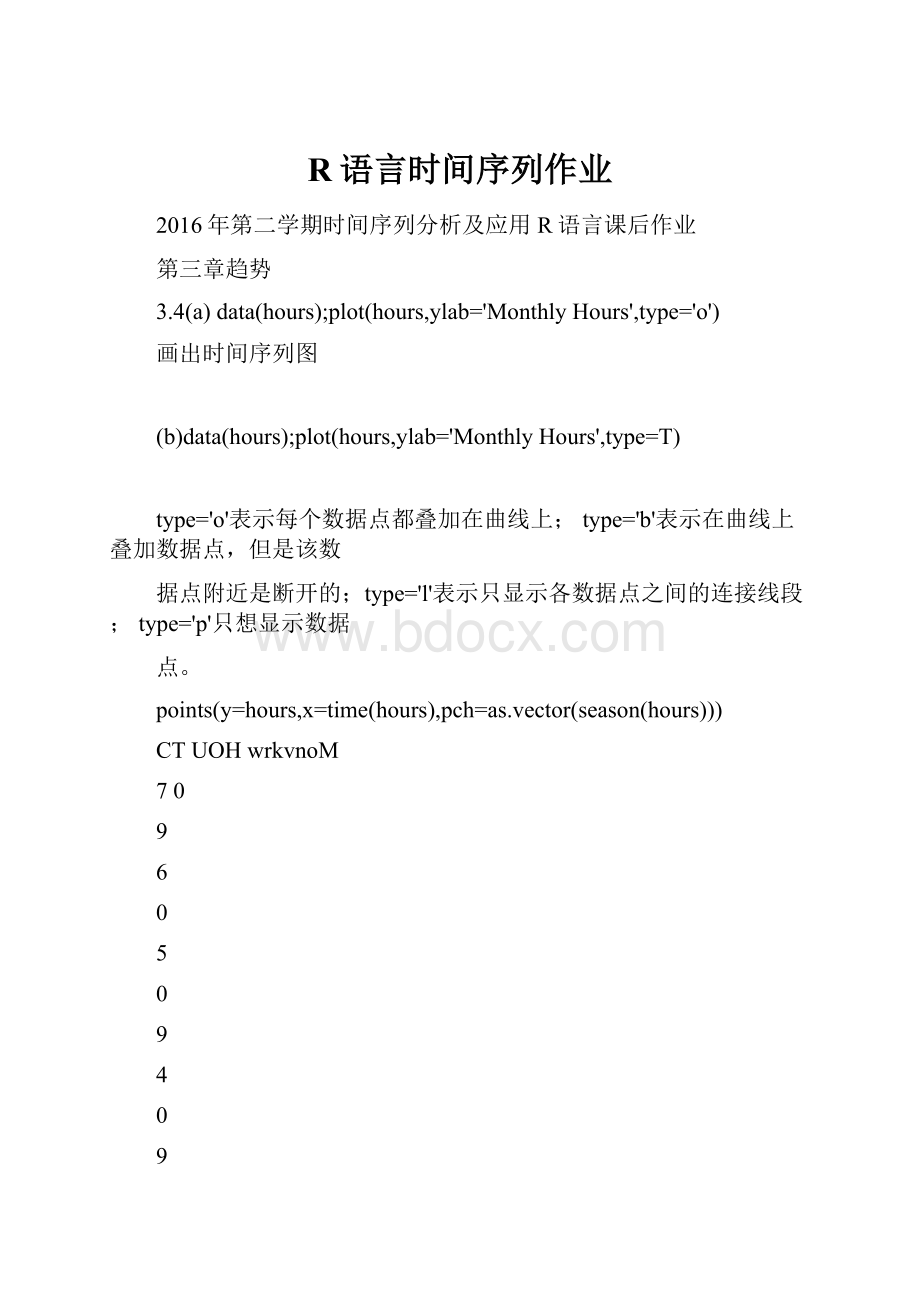
3.4(a)data(hours);plot(hours,ylab='MonthlyHours',type='o')
画出时间序列图
(b)data(hours);plot(hours,ylab='MonthlyHours',type=T)
type='o'表示每个数据点都叠加在曲线上;type='b'表示在曲线上叠加数据点,但是该数
据点附近是断开的;type='l'表示只显示各数据点之间的连接线段;type='p'只想显示数据
点。
points(y=hours,x=time(hours),pch=as.vector(season(hours)))
CTUOHwrkvnoM
70
9
6
0
5
0
9
4
0
9
30
3.10(a)data(hours);hours.lm=lm(hours~time(hours)+I(time(hours)A2));summary(hours.lm)
用最小二乘法拟合二次趋势,结果显示如下:
Call:
lm(formula=hours~time(hours)+I(time(hours)A2))
Residuals:
Min1QMedian3QMax-1.00603-0.25431-0.022670.228840.98358
Coefficients:
EstimateStd.ErrortvaluePr(>|t|)(Intercept)-5.122e+051.155e+05-4.4334.28e-05***time(hours)5.159e+021.164e+024.4314.31e-05***
I(time(hours)A2)-1.299e-012.933e-02-4.4284.35e-05***
—Signif.codes:
0'***'0.001'**'0.01'*'0.05'.'0.1''1
Residualstandarderror:
0.423on57degreesoffreedomMultipleR-squared:
0.5921,AdjustedR-squared:
0.5778
F-statistic:
41.37on2and57DF,p-value:
7.97e-12
(b)plot(y=rstudent(hours.lm),x=as.vector(time(hours)),type='l',ylab='StandardizedResiduals')points(y=rstudent(hours.lm),x=as.vector(time(hours)),pch=as.vector(season(hours)))
标准残差的时间序列,应用月度绘图标志。
(为了更容易识别季节性)
带季节性图标的的残差-时间图
(c)runs(rstudent(hours.lm))
对标准差进行游程检验
$pvalue
[1]0.00012
$observed.runs
[1]16
$expected.runs
[1]30.96667
$n1
[1]31
$n2
[1]29
$k
[1]0
结果解释:
P值为0.00012,表明非随机性是合理的。
(d)acf(rstudent(hours.lm))
标准残差的样本自相关函数
(e)qqnorm(rstudent(hours.lm));qqline(rstudent(hours.lm))
(QQ图)
正态性可以通过正态得分或者分位数-分位数(QQ)图来检验。
此处的直线型图形支持了该模型中随机项是正态分布的假设。
hIst(rstudent(hours.lm),xlab='StandardIzedResiduals')
标准残差的直方图(季节均值模型的标准残差直方图)
shapiro.test(rstudent(hours.lm))
正态性检验(Shapiro-Wilk检验)本质是:
计算残差与相应的正态分位数之间的相关系数。
相关性越小,就越有理由否定正态性。
Shapiro-Wilknormalitytest
data:
rstudent(hours.lm)
W=0.99385,p-value=0.9909
根据上面的检验结果,我们不能拒绝模型的随机项是正态分布的假设。
第四章平稳时间序列模型
4.4
11
第五章非平稳时间序列模型
5.1(a)ARMA(2,1)p=2,q=1,参数值4和。
41=1力2=-0.25@1=0.1
(b)IMA(2,0)p=2,d=1,q=0,参数值4和0
(c)ARMA(2,2)p=2,q=2,参数值4和0
())1=0.5())2=-0.5@1=0.5@2=-0.25
5.7(a)A:
AR
(2)力1=0.942=0.09
B:
IMA(1,1)@1=0.1
(b)一个是固定的一个是不固定的。
5.11(a)data(winnebago);win.graph(width=6.5,height=3,pointsize=8)
plot(winnebago,type='o',ylab='WinnebagoMonthlySales')时间序列图
表明公司的休闲车的销量在逐渐增加。
(b)plot(log(winnebago),type='o',ylab='Log(MonthlySales)')
取对数之后的时间序列图
仍然呈现增加的趋势,但是比没有取对数之前增加的缓慢一些。
(c)percentage=na.omit((winnebago-zlag(winnebago))/zlag(winnebago))
win.graph(width=3,height=3,pointsize=8)
plot(x=diff(log(winnebago))[-1],y=percentage[-1],ylab='Percentage
Change',xlab='DifferenceofLogs')
cor(diff(log(winnebago))[-1],percentage[-1])
[1]0.9646886
结果显示:
0.96认为一致。
第六章模型识别
6.29(a)set.seed(762534);series=arima.sim(n=60,list(ar=0.4,ma=0.6))
phi=0.4;theta=0.6;ACF=ARMAacf(ar=phi,ma=-theta,lag.max=10)
plot(y=ACF[-1],x=1:
10,xlab='Lag',ylab='ACF',type='h',ylim=c(-.2,.2));abline(h=0)
Lag
(b)acf(series)
Lag
第八章模型诊断
8.7(a)data(hare);model=arima(sqrt(hare),order=c(3,0,0))
win.graph(width=6.5,height=3,pointsize=8);acf(rstandard(model))
残差的样本自相关图
(b)LB.test(model,lag=9)
Box-Ljungtest
data:
residualsfrommodel
X-squared=6.2475,df=6,p-value=0.396
JB统计量结果表明不拒绝误差项的独立性。
(c)对残差进行检验。
runs(rstandard(model))
$pvalue
[1]0.602
$observed.runs
[1]18
$expected.runs
[1]16.09677
$n1
[1]13
$n2
[1]18
$k
[1]0
P值为0.602,不拒绝误差项的独立性。
(d)win.graph(width=3,height=3,pointsize=8)
qqnorm(residuals(model))
残差的正态QQ图
QQ图看出有一点小的曲率,但是这种现象可能是俩个极端值造成的。
(e)对残差的正态性进行shapiro-wilk检验
shapiro.test(residuals(model))
Shapiro-Wilknormalitytest
data:
residuals(model)
W=0.93509,p-value=0.06043
结果表明,我们不会拒绝通常意义水平的正态性。
第九章预测
所以,Y2008
(1)Y2007
(2)
9.2(a)Y2007
(1)51.1Y20070.5Y200651.1(10)0.5(11)10.5
所以,Y2007
(2)
5
1.1Y2008
0.5Y20075
1.1(10.5)0.5(10)11.55
(b)从上式中看出
1
1.1,
1-100,
01,111.1
(c)Y2007
(1)2.
2
10.5
2.210.5
2.83即2008年预测的95%预测极限为
7.67-13.33.
(d)因为有,Yt1
(t)
丫奇
1)tY1
丫⑴
1Y2008Y2007
(1)11.551.11210.513.2
第十章季节模型
10.12(a)data(boardings);series=boardings[,1]
plot(series,type=T,ylab='LightRail&BusBoardings')
points(series,x=time(series),pch=as.vector(season(series)))
a
Bs
B
200120022003200420052006
Time
(b)acf(as.vector(series),ci.type='ma')
滞后期为1,5,6,12,时候,存在显著的自相关。
(c)model=arima(series,order=c(0,0,3),seasonal=list(order=c(1,0,0),period=12));model
Call:
arima(x=series,order=c(0,0,3),seasonal=list(order=c(1,0,0),period=12))Coefficients:
ma1
ma2
ma3
sar1
intercept
0.7290
0.6116
0.2950
0.8776
12.5455
s.e.0.1186
0.1172
0.1118
0.0507
0.0354
sigmaA2estimatedas0.0006542
:
:
loglikelihood=
143.54,aic=-277.09
所有的变量都是显著的。
(d)model2=arima(series,order=c(0,0,4),seasonal=list(order=c(1,0,0),period=12));model2
Call:
arima(x=series,order=c(0,0,4),seasonal=list(order=c(1,0,0),period=12))Coefficients:
ma1
ma2
ma3
ma4
sar1
intercept
0.7277
0.6686
0.4244
0.1414
0.8918
12.5459
s.e.
0.1212
0.1327
0.1681
0.1228
0.0445
0.0419
sigmaA2estimatedas0.0006279:
loglikelihood=144.22,aic=-276.45
模型2中AIC=-276.45,模型1中的AIC=-277.09,AIC越小越好,所以模型是过度拟合的。
第十二章异方差时间序列模型
12.1library(TSA)
data(CREF)
r.cref=diff(log(CREF))*100
win.graph(width=4.875,height=2.5,pointsize=8)
plot(abs(r.cref))
win.graph(width=4.875,height=2.5,pointsize=8)plot(r.crefA2)
12.9(a)>data(google)
>plot(google)
收益率数据的时间序列图
>acf(google)
>pacf(google)
根据ACF和PACF可以得知,无自相关。
(b)计算google日收益率均值。
>t.test(google,alternative='greater')
OneSamplet-test
data:
google
t=2.5689,df=520,p-value=0.00524
alternativehypothesis:
truemeanisgreaterthan0
95percentconfidenceinterval:
0.000962967Inf
sampleestimates:
meanofx
0.002685589
x的均值为0.002685589,备择假设为:
均值异于0,根据P值显示,0.00524接受备择假设。
(c)McLeod-Li检验ARCH效应。
>win.graph(width=4.875,height=3,pointsize=8)
>McLeod.Li.test(y=google)
以-u••心“-♦e廿♦弋-■■um•:
「7。
区u
IHII
95101525
Lag
根据图显示,所有滞后值在5%的水平上均显著。
说明数据具有ARCH特征。
(d)识别GARCH莫型,估计识别的模型并对拟合的模型进行模型诊断检验。
>eacf(googleA2)
取值平方的样本EACF
AR/MA
012345678910111213
0xxoooooooxooox
1xooooooooxooox
2xooooooooxooox
3xxxooooooxooox
4xxxooooooooooo
5xxxooooooooooo
6xxxxoooooooooo
7oxxooxoooooooo
>eacf(abs(google))
绝对值的样本EACF
AR/MA
012345678910111213
0xxxoooxooxooxx
1xoooooooooooox
2xxooooooooooox
3xxxoooooooooox
4xoxooooooooooo
5xoxoxooooooooo
6oxxxxxoooooooo
7xoxxxoxooooooo
根据上图,得知设定GARCH(1,1)模型。
Google日收益率的平方值相应的样本EACF也得知模
型GARCH(1,1)符合。
检验模型:
>m1=garch(x=google,order=c(1,1))
>summary(m1)
Call:
garch(x=google,order=c(1,1))
Model:
GARCH(1,1)
Residuals:
Min1QMedian3QMax
-3.64597-0.464860.082320.653795.73937
Coefficient(s):
EstimateStd.ErrortvaluePr(>|t|)
a05.058e-051.232e-054.1064.03e-05***
a11.264e-012.136e-025.9203.21e-09***
b17.865e-013.578e-0221.980<2e-16***
—
Signif.codes:
0'***'0.001'**'0.01'*'0.05'.'0.1''1
DiagnosticTests:
JarqueBeraTest
data:
Residuals
X-squared=223.86,df=2,p-value<2.2e-16
Box-Ljungtest
data:
Squared.Residuals
X-squared=0.00066246,df=1,p-value=0.9795
模型诊断:
对google日收益率拟合的GARCH(1,1)模型的标准残差
>plot(residuals(m1),type='h',ylab='StandardizedResiduals')
标准残差的QQ正态得分图
>win.graph(width=2.5,height=2.5,pointsize=8)
>qqnorm(residuals(m1));qqline(residuals(m1))
TheoreticalQuantilea
如果模型识别正确,那么残差应该是近似独立同分布的。
从上qq图中显示并不明确。
所以我们进行广义混合检验。
绘制google日收益率的GARCHI(1,1)模型的标准残差平方的样本ACF
acf(residuals(m1)A2,na.action=na.omit)
SeriesresiduQls(m1>A2
排S
CD
0
从图形中得出总体印象是残差平方序列不相关。
进行广义混合检验得到的p值
gBox(m1,method='squared')
结果显示错误!
!
!
不清楚为什么!
!
!
在这里继续使用绝对标准残差重新对模型进行检验o
绝对标准残差的样本ACF
acf(abs(residuals(m1)),na.action=na.omit)
gBox(m1,method='absolute')
(e)绘制并评论估计的条件方差的时间序列图
图中显示出来有几个时期的波动率较高。
(f)对拟合模型的标准残差绘制QQ图
qqnorm(residuals(m1));qqline(residuals(m1))
残差看起来并不正常。
(g)构造bl的95%的置信区间。
(0.7865-1.96*0.03578,0.7865+1.96*0.03578)=(0.7164,
0.8566)