概率论升级版.docx
《概率论升级版.docx》由会员分享,可在线阅读,更多相关《概率论升级版.docx(34页珍藏版)》请在冰豆网上搜索。
概率论升级版
1.计算数字特征的SAS程序
(一)不需要输入频数的SAS程序(见课本138页)
dataex;inputx@@;
cards;
12233345678
;
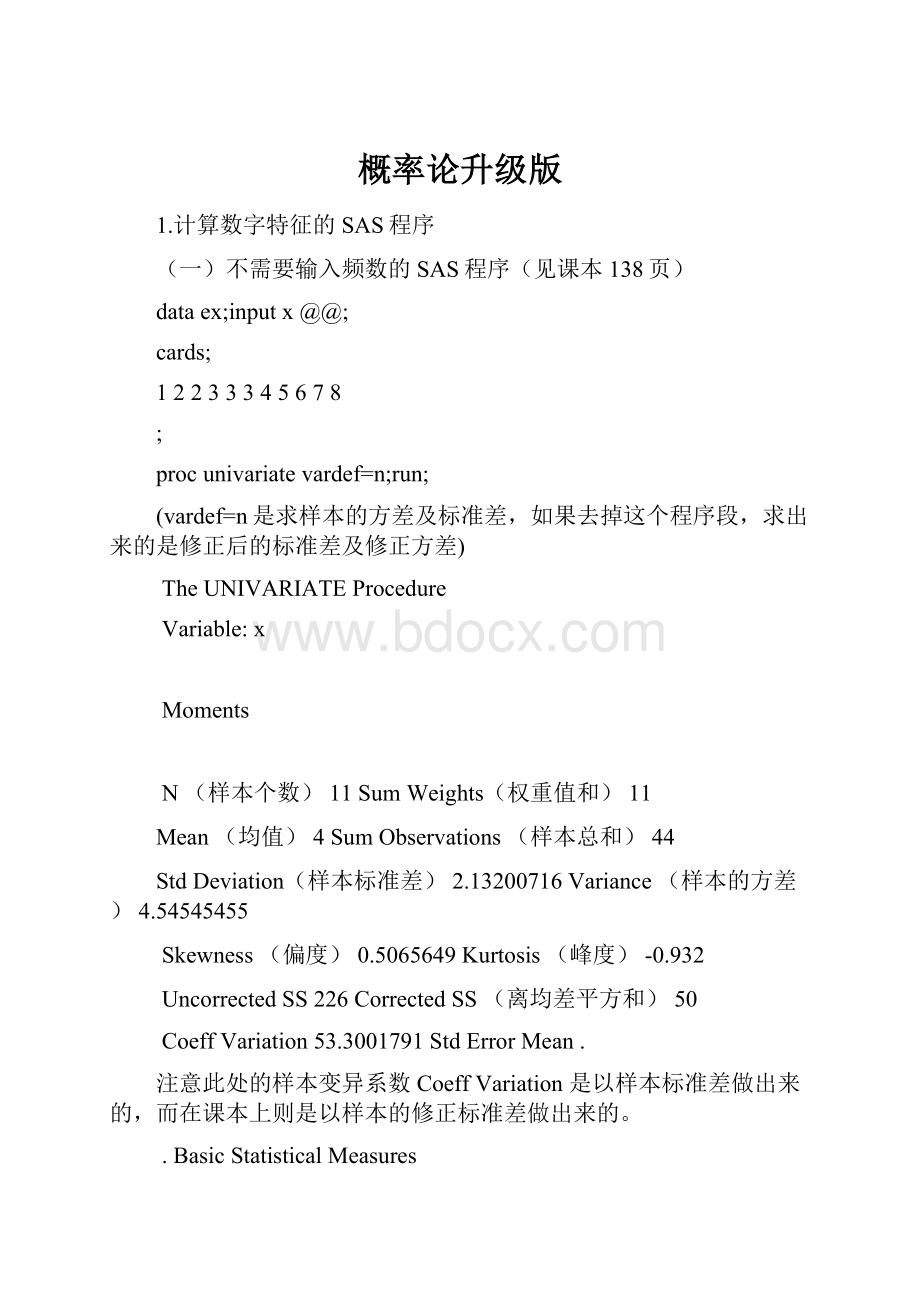
procunivariatevardef=n;run;
(vardef=n是求样本的方差及标准差,如果去掉这个程序段,求出来的是修正后的标准差及修正方差)
TheUNIVARIATEProcedure
Variable:
x
Moments
N(样本个数)11SumWeights(权重值和)11
Mean(均值)4SumObservations(样本总和)44
StdDeviation(样本标准差)2.13200716Variance(样本的方差)4.54545455
Skewness(偏度)0.5065649Kurtosis(峰度)-0.932
UncorrectedSS226CorrectedSS(离均差平方和)50
CoeffVariation53.3001791StdErrorMean.
注意此处的样本变异系数CoeffVariation是以样本标准差做出来的,而在课本上则是以样本的修正标准差做出来的。
.BasicStatisticalMeasures
LocationVariability
Mean4.000000StdDeviation2.13201
Median(中位数)3.000000Variance4.54545
Mode(众数)3.000000Range(极差)7.00000
InterquartileRange4.00000
TestsforLocation:
Mu0=0
Test-Statistic------pValue------
SignM5.5Pr>=|M|0.0010
SignedRankS33Pr>=|S|0.0010
Quantiles(Definition5)
QuantileEstimate(分位数)
100%Max8
99%8
95%8
90%7
75%Q36
50%Median3
25%Q12
10%2
5%1
1%1
0%Min1
ExtremeObservations
----Lowest--------Highest---
ValueObsValueObs
1147
2358
2269
36710
35811
(二)需要输入频数的SAS程序(见课本138页)
dataex;inputxf@@;
cards;
5.547.5119.51711.523
13.51815.51417.51019.53
;
procunivariatevardef=n;varx;freqf;run;
(vardef=n是求样本的方差及标准差,如果去掉这个程序段,求出来的是修正后的标准差及修正方差,varx表示计算的是x的数字特征,freqf表示f为频数)
TheUNIVARIATEProcedure
Variable:
x
Freq:
f
Moments
N100SumWeights100
Mean12.24SumObservations1224
StdDeviation3.43691722Variance11.8124
Skewness0.09092138Kurtosis-0.6788022
UncorrectedSS16163CorrectedSS1181.24
CoeffVariation28.0793891StdErrorMean.
BasicStatisticalMeasures
LocationVariability
Mean12.24000StdDeviation3.43692
Median11.50000Variance11.81240
Mode11.50000Range14.00000
InterquartileRange6.00000
TestsforLocation:
Mu0=0
Test-Statistic------pValue------
SignM50Pr>=|M|<.0001
SignedRankS2525Pr>=|S|<.0001
Quantiles(Definition5)
QuantileEstimate
100%Max19.5
99%19.5
95%17.5
90%17.5
75%Q315.5
50%Median11.5
25%Q19.5
10%7.5
5%7.5
1%5.5
0%Min5.5
ExtremeObservations
---------Lowest----------------Highest--------
ValueFreqObsValueFreqObs
5.54111.5234
7.511213.5185
9.517315.5146
11.523417.5107
13.518519.538
2:
求置信区间
(1)求一个正态总体均值的置信区间
SAS程序为
dataex;inputx@@;
cards;
6.64.65.45.85.5
;
procmeansmeanstdclm;
procmeansmeanstdclmalpha=0.1;run;
运算结果AnalysisVariable:
x
Lower90%Upper90%
Mean(均值)StdDev(观测值的标准差)CLforMeanCLforMean
5.58000000.72249574.89117926.2688208
即在置信度为0.1的条件下此正太总体的均值的90%的置信区间为(4.8911792,6.2688208)
(2)求两个正态总体均值差的置信区间(此程序还可以用来方差分析)
SAS程序为:
dataex;doa=1to2;inputn@@;
doi=1ton;inputx@@;
output;end;end;
cards;
62.12.352.392.412.442.56
42.032.282.582.71
;
procanova;classa;modelx=a;
meansa/lsdcldiff;run;
运算结果:
ClassLevelInformation
ClassLevelsValues
a212
DependentVariable:
x
SumofSourceDFSquaresMeanSquareFValuePr>FModel10.001500000.001500000.030.8661Error80.395950000.04949375CorrectedTotal90.39745000
R-SquareCoeffVarRootMSExMean0.0037749.3279630.2224722.385000
SourceDFAnovaSSMeanSquareFValuePr>Fa10.001500000.001500000.030.8661
tTests(LSD)forxNOTE:
ThistestcontrolstheTypeIcomparisonwiseerrorrate,nottheexperimentwiseerrorrate.
Alpha0.05
ErrorDegreesofFreedom8
ErrorMeanSquare0.049494
CriticalValueoft2.30600
Comparisonssignificantatthe0.05levelareindicatedby***.
DifferenceaBetween95%ConfidenceComparisonMeans(样本均值差)Limits(两个样本均值差的95%置信区间)
2-1(x2-x1)0.02500-0.306150.35615
1-2(x1-x2)-0.02500-0.356150.30615
3:
应用SAS作总体分布参数的假设检验
(1)一个正态总体均值作假设检验的SAS程序(课本186页)
dataex;inputx@@;y=x-14;
cards;
10.41213.213.714.615.115.515.9
;
procmeansmeanstdtprt;vary;run;
程序运行的结果为:
MeanStdDev(观测值的标准差)tValuePr>|t|
-0.20000001.8822479-0.300.7725
T的观测值为-0.30,而根据查表可知当自由度为8,t值为1.860,也就是落在了拒绝域,因此拒绝原假设,接受对立假设。
(2)两个正态总体均值作假设检验的SAS程序(课本179页,例题1.5,公式六,F分布)
dataxzh;doa=1to2;doi=1to8;
inputx@@;output;end;end;
cards;
8.68.75.69.38.49.37.57.9
87.95.89.17.78.27.46.6
;
procttest;classa;varx;
run;
程序运行的结果为:
LowerCLUpperCLLowerCLUpperCLVariableaNMeanMean(均值)MeanStdDevStdDevStdDevStdErrx187.15348.16259.17160.79811.2072.45670.4268x286.74267.58758.43240.66821.01062.05680.3573xDiff(1-2)-0.6190.5751.76870.8151.11321.75560.5566
T-Tests
VariableMethodVariances(方差)DFtValuePr>|t|(只要大于显著水平0.05便可)
xPooledEqual(方差相等时)141.030.3191
xSatterthwaiteUnequal(方差不相等时)13.61.030.3196
EqualityofVariances
VariableMethodNumDFDenDFFValuePr>F(只要大于置信度,即0.05便接受原假设)
xFoldedF771.430.6509
首先进行F检验,检验其方差是否相等,因为T检验中提供了两种均值的检测方法,一种是方差相等一种是方差不等,然后再通过T检验看均值是否相等。
在此题中F的观测值是1.43,而在95%的置信度中F的值为3.79,即落在接受域中,接受方差相等,再看T检验,T值为1.03,而查表知T的0.05置信度的值为1.761,因此接受原假设,认为均值相等。
4.应用SAS作正态性检验(详见课本193页)
SAS程序为
dataex;inputx@@;
cards;
10.41213.113.813.814.615.115.515.9
;
procunivariatenormal;run;
4.独立性检验的SAS程序
dataex;doa=1to3;dob=1to3;
inputf@@;output;end;end;
cards;
323858454428141823
;
procfreq;weightf;
tablesa*b/chisp;run;
运行结果:
ab
Frequency‚
Percent‚
RowPct‚
ColPct‚1‚2‚3‚Total
1‚32‚38‚58‚128
‚10.67‚12.67‚19.33‚42.67
‚25.00‚29.69‚45.31‚
‚35.16‚38.00‚53.21‚
2‚45‚44‚28‚117
‚15.00‚14.67‚9.33‚39.00
‚38.46‚37.61‚23.93‚
‚49.45‚44.00‚25.69‚
3‚14‚18‚23‚55
‚4.67‚6.00‚7.67‚18.33
‚25.45‚32.73‚41.82‚
‚15.38‚18.00‚21.10‚
Total91100109300
30.3333.3336.33100.00
StatisticsforTableofabyb
StatisticDFValueProb
Chi-Square(卡方检验值)413.58620.0087(概率小于显著水平0.05因此拒绝原假设)LikelihoodRatioChi-Square413.93660.0075
Mantel-HaenszelChi-Square11.44880.2287
PhiCoefficient0.2128
ContingencyCoefficient0.2081
Cramer'sV0.1505
SampleSize=300
5:
应用SAS作单因素试验方差分析
(1)不等重复的情形:
(课本200页例题1.1)
dataex;doa=1to3;inputn@@;
doi=1ton;inputx@@;
Output;end;end;
cards;
8
2129242225302726
10
20252523293124262021
6
242228252126
;
procanova;classa;modelx=a;run;
(如果要作多重比较并求均值差的置信区间,则增加
meansa/lsdcldiff;run;)
ClassLevelInformation
ClassLevelsValues
a3123
Numberofobservations24
TheANOVAProcedure
DependentVariable:
x
Sumof
SourceDF(自由度)Squares(平方和)MeanSquare(均方和)FValuePr>F
Model(因素A)26.76666673.38333330.320.7314
Error(误差)21223.733333310.6539683
CorrectedTotal(总和)23230.5000000
R-SquareCoeffVarRootMSExMean
0.02935613.188053.26404224.75000
SourceDFAnovaSSMeanSquareFValuePr>F
a26.766666673.383333330.320.7314
TheANOVAProcedure
tTests(LSD)forx
NOTE:
ThistestcontrolstheTypeIcomparisonwiseerrorrate,nottheexperimentwiseerrorrate.
Alpha0.05
ErrorDegreesofFreedom21
ErrorMeanSquare10.65397
CriticalValueoft2.07961
Comparisonssignificantatthe0.05levelareindicatedby***.
Difference
aBetween95%Confidence
ComparisonMeansLimits
1-21.100-2.1204.320
1-31.167-2.4994.833
2-1-1.100-4.3202.120
2-30.067-3.4393.572
3-1-1.167-4.8332.499
3-2-0.067-3.5723.439
(2)等重复的情形:
(课本201页,例题1.2)
dataex;doa=1to4;
doi=1to4;inputx@@;
output;end;end;
cards;
1923211321242720
2018191522252722
;
procanova;classa;modelx=a;
meansa/lsdcldiff;run;
ClassLevelInformation
ClassLevelsValues
a41234
Numberofobservations16
TheANOVAProcedure
DependentVariable:
x
Sumof
SourceDF(自由度)Squares(平方和)MeanSquareFValuePr>F
Model(因素A)3104.000000034.66666673.530.0487
Error(误差)12118.00000009.8333333
CorrectedTotal(总和)15222.0000000
R-SquareCoeffVarRootMSExMean
0.46846814.932453.13581521.00000
SourceDFAnovaSSMeanSquareFValuePr>F
a3104.000000034.66666673.530.0487
TheANOVAProcedure
tTests(LSD)forx
NOTE:
ThistestcontrolstheTypeIcomparisonwiseerrorrate,nottheexperimentwiseerrorrate.
Alpha0.05
ErrorDegreesofFreedom12
ErrorMeanSquare9.833333
CriticalValueoft2.17881
LeastSignificantDifference4.8312
Comparisonssignificantatthe0.05levelareindicatedby***.
Difference
aBetween95%Confidence
ComparisonMeansLimits
4-21.000-3.8315.831
4-15.0000.1699.831***
4-36.0001.16910.831***
2-4-1.000-5.8313.831
2-14.000-0.8318.831
2-35.0000.1699.831***
1-4-5.000-9.831-0.169***
1-2-4.000-8.8310.831
1-31.000-3.8315.831
3-4-6.000-10.831-1.169***
3-2-5.000-9.831-0.169***
3-1-1.000-5.8313.831
此处的Pr>F值小于显著性水平0.05,所以落在拒绝域,因此拒绝原假设,接受对立假设,认为苗高之间有显著差异。
6.双因素试验方差分析(不考虑交互作用)(课本212页例题2.1)
dataanova01;doa=1to4;dob=1to5;
inputx@@;output;end;end;
cards;
53564552494750474753
57635457584552424148
;
procanova;classab;modelx=ab;
meansab/lsdduncancldiff;run;
运行结果:
ClassLevelInformation
ClassLevelsValues
a41234
b512345
Numberofobservations20
DependentVariable:
x
 升级会员
升级会员 