数据分析72.docx
《数据分析72.docx》由会员分享,可在线阅读,更多相关《数据分析72.docx(11页珍藏版)》请在冰豆网上搜索。
数据分析72
Question1
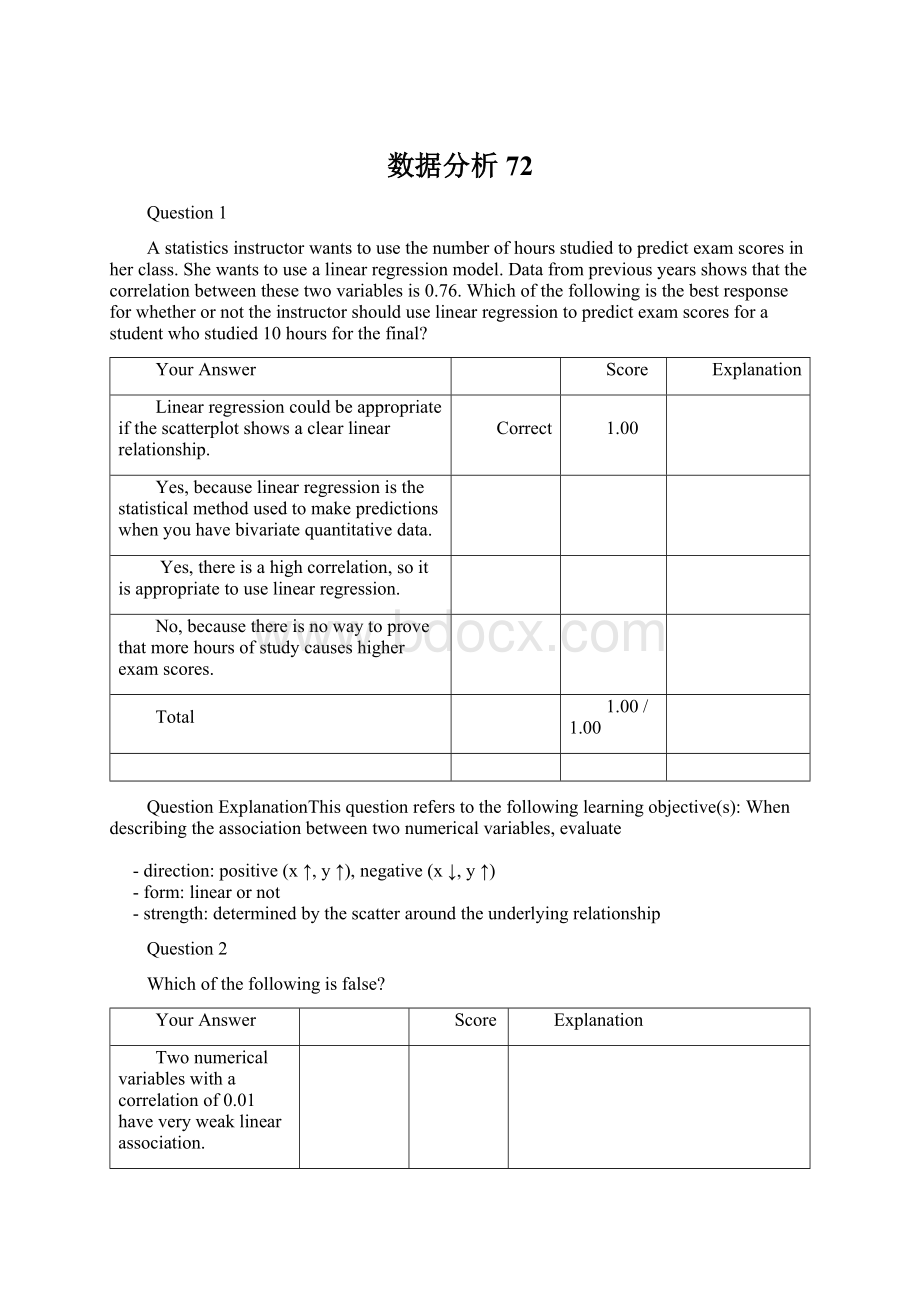
Astatisticsinstructorwantstousethenumberofhoursstudiedtopredictexamscoresinherclass.Shewantstousealinearregressionmodel.Datafrompreviousyearsshowsthatthecorrelationbetweenthesetwovariablesis0.76.Whichofthefollowingisthebestresponseforwhetherornottheinstructorshoulduselinearregressiontopredictexamscoresforastudentwhostudied10hoursforthefinal?
YourAnswer
Score
Explanation
Linearregressioncouldbeappropriateifthescatterplotshowsaclearlinearrelationship.
Correct
1.00
Yes,becauselinearregressionisthestatisticalmethodusedtomakepredictionswhenyouhavebivariatequantitativedata.
Yes,thereisahighcorrelation,soitisappropriatetouselinearregression.
No,becausethereisnowaytoprovethatmorehoursofstudycauseshigherexamscores.
Total
1.00/1.00
QuestionExplanationThisquestionreferstothefollowinglearningobjective(s):
Whendescribingtheassociationbetweentwonumericalvariables,evaluate
-direction:
positive(x↑,y↑),negative(x↓,y↑)
-form:
linearornot
-strength:
determinedbythescatteraroundtheunderlyingrelationship
Question2
Whichofthefollowingisfalse?
YourAnswer
Score
Explanation
Twonumericalvariableswithacorrelationof0.01haveveryweaklinearassociation.
Correlationmeasuresthestrengthofthelinearassociationbetweentwonumericalvariables.
Correlationcoefficientandtheslopealwayshavethesamesign(positiveornegative).
Ifthecorrelationcoefficientis1,thentheslopemustbe1aswell.
Correct
1.00
Theslopedoesnotnecessarilyhavetobe1.Imagineadependentvariablewhichincreasesbyprecisely2unitsforevery1unitincreaseintheexplanatoryvariable.ThesevariableshavecorrelationcoefficientR=1yettheslopeoftheregressionlinewouldbe2.
Total
1.00/1.00
QuestionExplanationThisquestionreferstothefollowinglearningobjective(s):
Notethatcorrelationco-efficient(R,alsocalledPearson’sR)hasthefollowingproperties:
-themagnitude(absolutevalue)ofthecorrelationcoefficientmeasuresthestrengthofthelinearassociationbetweentwonumericalvariables
-thesignofthecorrelationcoefficientindicatesthedirectionofassociation
-thecorrelationcoefficientisalwaysbetween-1and1,-1indicatingperfectnegativelinearassociation,+1indicatingperfectpositivelinearassociation,and0indicatingnolinearrelationship
-thecorrelationcoefficientisunitless
-sincethecorrelationcoefficientisunitless,itisnotaffectedbychangesinthecenterorscaleofeithervariable(suchasunitconversions)
-thecorrelationofXwithYisthesameasofYwithX
-thecorrelationcoefficientissensitivetooutliers
Question3
Fillintheblank:
Residualsoflinearmodelsshouldbedistributednearlynormallyaround__________.
YourAnswer
Score
Explanation
themeanofy^(thepredictedvalues)
0
Correct
1.00
themeanofx
themeanofy
Total
1.00/1.00
QuestionExplanationThisquestionreferstothefollowinglearningobjective(s):
•Defineresidual(e)asthedifferencebetweentheobserved(y)andpredicted(y^)valuesoftheresponsevariable.
ei=yi−y^i
•Definetheleastsquareslineasthelinethatminimizesthesumofthesquaredresiduals,andlistconditionsnecessaryforfittingsuchline:
(1)linearity
(2)nearlynormalresiduals
(3)constantvariability
Question4
SixteenstudentvolunteersatOhioStateUniversitydrankarandomlyassignednumberbeers.Thirtyminuteslater,apoliceofficermeasuredtheirbloodalcoholcontent(BAC)ingramsofalcoholperdeciliterofblood.Thescatterplotdisplaystherela-tionshipbetweenBACandnumberofbeersconsumed.Supposeamistakewasfoundinthedata:
thestudentwhosupposedlydrankthehighestnumberofbeers(9beers)actuallyonlydrank6.HisBACwasrecordedcorrectly.Inanewscatterplot,howwouldthestrengthoftheassociationappear-comparedtothestrengthoftheassociationshownhere?
YourAnswer
Score
Explanation
Roughlythesameasthestrengthoftheassociationshownintheabovescatterplot.
Weakerthanthestrengthoftheassociationshownintheabovescatterplot.
Strongerthanthestrengthoftheassociationshownintheabovescatterplot.
It’simpossibletotell.
Inorrect
0.00
Movingtherightmostpointbacktox=6wouldresultinascatterplotwherethereismorescatteraroundthemaintrendofthedata.Thereforewewouldsaythenewstrengthofassociationwouldbeweakerthanthatshownabove.
Total
0.00/1.00
QuestionExplanationThisquestionreferstothefollowinglearningobjective(s):
Whendescribingtheassociationbetweentwonumericalvariables,evaluate
-direction:
positive(x↑,y↑),negative(x↓,y↑)
-form:
linearornot
-strength:
determinedbythescatteraroundtheunderlyingrelationship.
Question5
TheR2forthelinearregressionoftwovariablesxandyis0.60.Thevariablesarenegativelyassociated.Whichofthefollowingthecorrectcorrelationcoefficient?
Choosetheclosestanswer.
YourAnswer
Score
Explanation
0.40
-0.77
Correct
1.00
0.60−−−−√≈0.77,butthecorrelationcoefficientisnegativesincethevariablesarenegativelyassociated.
-0.36
0.36
0.77
Total
1.00/1.00
QuestionExplanationThisquestionreferstothefollowinglearningobjective(s):
DefineR2asthepercentageofthevariabilityintheresponsevariableexplainedbythetheexplanatoryvariable.
-Foragoodmodel,wewouldlikethisnumbertobeascloseto100%aspossible.
-Thisvalueiscalculatedasthesquareofthecorrelationcoefficient.
Question6
Thescatterplotontherightshowstherelationshipbetweenpercentageofwhiteresidentsandpercentageofhouseholdswithafemalehead(wherenohusbandispresent)inall50USStatesandtheDistrictofColumbia(DC).WhichofthebelowbestdescribesthetwopointsmarkedasDCandHawaii?
YourAnswer
Score
Explanation
HawaiihashigherleverageandismoreinfluentialthanDC.
Correct
1.00
HawaiihashigherleveragethanDCbecauseitisfartherawayfromthebulkofthedatainthexdirection.
DCismoreinfluentialthanHawaii,butithaslowerleveragethanHawaii.
Hawaiiisnotanoutlier,andDCisnotaleveragepoint.
DCisnotanoutlier,andHawaiiisaleveragepoint.
DCandHawaiishouldbothbeexcludedfromasimplelinearregressionanalysis.
Total
1.00/1.00
QuestionExplanationThisquestionreferstothefollowinglearningobjective(s):
-Definealeveragepointasapointthatliesawayfromthecenterofthedatainthehorizontaldirection.
-Defineaninfluentialpointasapointthatinfluences(changes)theslopeoftheregressionline.Thisisusuallyaleveragepointthatisawayfromthetrajectoryoftherestofthedata.
Question7
Acolleagueneedssomehelpwithastatisticsproblem:
Hebringsyoutheplotshownbelow,alongwithacorrelationcoefficientof0.03whichhecalculatedhimself.Theplotshowstwonumericalvariableswhichareobviouslystronglyrelated,andasaresultyourcolleagueisafraidhemadeamistakecalculatingthecorrelationcoefficient:
thatis,hewassurprisedtogetananswersocloseto0.Givenonlythisinformation,whichofthefollowingresponsesisthebesttogiveyourcolleague?
YourAnswer
Score
Explanation
Thecorrelationcoefficientmeasuresthestrengthofthelinearrelationship,thereforetwovariablesthathaveastrongnon-linearassociationmightstillhavealowcorrelationcoefficient.
Correct
1.00
Yourcolleaguemusthavemadeamistakeinhiscalculations.Amuchhighercorrelationcoefficientisexpectedforvariablesthatshowaclearassociation.
Total
1.00/1.00
QuestionExplanationThisquestionreferstothefollowinglearningobjective(s):
-Definecorrelationasthelinearassociationbetweentwonumericalvariables.
-Notethatarelationshipthatisnonlinearissimplycalledanassociation.
-Notethatcorrelationcoefficient(R,alsocalledPearson’sR)hasthefollowingproperties:
-themagnitude(absolutevalue)ofthecorrelationcoefficientmeasuresthestrengthofthelinearassociationbetweentwonumericalvariables
-thesignofthecorrelationcoefficientindicatesthedirectionofassociation
-thecorrelationcoefficientisalwaysbetween-1and1,-1indicatingperfectnegativelinearassociation,+1indicatingperfectpositivelinearassociation,and0indicatingnolinearrelationship
-thecorrelationcoefficientisunitless
-sincethecorrelationcoefficientisunitless,itisnotaffectedbychangesinthecenterorscaleofeithervariable(suchasunitconversions)
-thecorrelationofXwithYisthesameasofYwithX
-thecorrelationcoefficientissensitivetooutliers
Question8
Basedonarandomsampleof170marriedcouplesinBritain,aresearcherfindsthattherelationshipbetweenthehusbands’andwives’agesisdescribedbythefollowingequation:
Whichofthefollowingisthebestinterpretationoftheslopeestimate?
YourAnswer
Score
Explanation
MostwivesinBritainare0.91yearsyoungerthantheirhusbands.
Onaverage,whenahusbandinBritaingets1yearolder,hiswifeonlygets0.91yearsolder.
Foreachadditionalyearincreaseofhusband’sage,wewouldexpectthewife’sagetobe0.91yearshigher,onaverage.
Correct
1.00
Foreachadditionalyearincreaseofwife’s
 升级会员
升级会员 