最新MATLAB练习题和答案.docx
《最新MATLAB练习题和答案.docx》由会员分享,可在线阅读,更多相关《最新MATLAB练习题和答案.docx(34页珍藏版)》请在冰豆网上搜索。

最新MATLAB练习题和答案
控制系统仿真实验
Matlab部分实验结果
实验一MATLAB基本操作
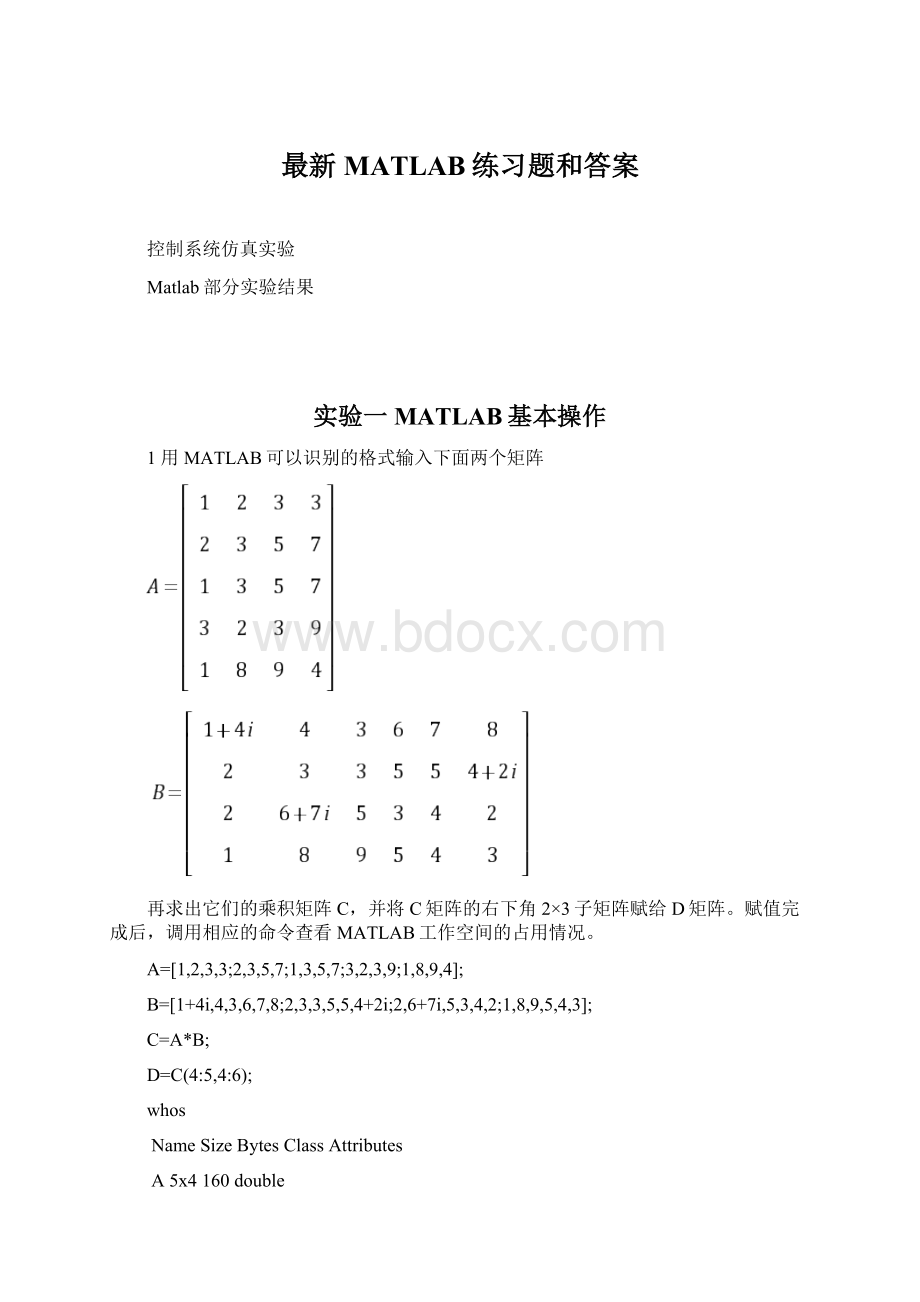
1用MATLAB可以识别的格式输入下面两个矩阵
再求出它们的乘积矩阵C,并将C矩阵的右下角2×3子矩阵赋给D矩阵。
赋值完成后,调用相应的命令查看MATLAB工作空间的占用情况。
A=[1,2,3,3;2,3,5,7;1,3,5,7;3,2,3,9;1,8,9,4];
B=[1+4i,4,3,6,7,8;2,3,3,5,5,4+2i;2,6+7i,5,3,4,2;1,8,9,5,4,3];
C=A*B;
D=C(4:
5,4:
6);
whos
NameSizeBytesClassAttributes
A5x4160double
B4x6384doublecomplex
C5x6480doublecomplex
D2x396doublecomplex
2选择合适的步距绘制出下面的图形
,其中
t=[-1:
0.1:
1];
y=sin(1./t);
plot(t,y)
3对下面给出的各个矩阵求取矩阵的行列式、秩、特征多项式、范数、特征根、特征向量和逆矩阵。
,
,
A=[7.5,3.5,0,0;8,33,4.1,0;0,9,103,-1.5;0,0,3.7,19.3];
B=[5,7,6,5;7,10,8,7;6,8,10,9;5,7,9,10];
C=[1:
4;5:
8;9:
12;13:
1rtf6];
D=[3,-3,-2,4;5,-5,1,8;11,8,5,-7;5,-1,-3,-1];
det(A);det(B);det(C);det(D);
rank(A);
rank(B);
rank(C);
rank(D);
a=poly(A);
b=poly(B);
c=poly(C);
d=poly(D);
norm(A);
norm(B);
norm(C);
norm(D);
[v,d]=eig(A,'nobalance');
[v,d]=eig(B,'nobalance');
[v,d]=eig(C,'nobalance');
[v,d]=eig(D,'nobalance');
m=inv(A);
n=inv(B);
p=inv(C);
q=inv(D);
4求解下面的线性代数方程,并验证得出的解真正满足原方程。
(a)
,(b)
(a)
A=[7,2,1,-2;9,15,3,-2;-2,-2,11,5;1,3,2,13];
B=[4;7;-1;0];
X=A\B;
C=A*X;
(b)
A=[1,3,2,13;7,2,1,-2;9,15,3,-2;-2,-2,11,5];
B=[9,0;6,4;11,7;-2,-1];
X=A\B;
C=A*X;
5.
(1)初始化一10*10矩阵,其元素均为1
ones(10,10);
(2)初始化一10*10矩阵,其元素均为0
zeros(10,10);
(3)初始化一10*10对角矩阵
v=[1:
10];
diag(v);
(4)输入A=[715;256;315],B=[111;222;333],执行下列命令,理解其含义
A(2,3)表示取A矩阵第2行、第3列的元素;
A(:
2) 表示取A矩阵的第2列全部元素;
A(3,:
)表示取A矩阵第3行的全部元素;
A(:
1:
2:
3)表示取A矩阵第1、3列的全部元素;
A(:
3).*B(:
2)表示A矩阵第3列的元素点乘B矩阵第2列的元素
A(:
3)*B(2,:
)表示A矩阵第3列的元素乘以B矩阵第2行
A*B矩阵AB相乘
A.*B矩阵A点乘矩阵B
A^2矩阵A的平方
A.^2矩阵表示求矩阵A的每一个元素的平方值
B/A表示方程AX=B的解X
B./A表示矩阵B的每一个元素点除矩阵A的元素
6在同一坐标系中绘制余弦曲线y=cos(t-0.25)和正弦曲线y=sin(t-0.5),t∈[0,2π],用不同颜色,不同线的类型予以表示,注意坐标轴的比例控制。
t=[0:
0.01:
2*pi];
y1=cos(t-0.25);
plot(t,y1,'r--')
holdon
y2=sin(t-0.5);
plot(t,y2,'k')
实验二Matlab编程
1分别用for和while循环结构编写程序,求出
并考虑一种避免循环的简洁方法来进行求和。
(a)j=1;n=0;sum=1;
forn=n+1:
63
fori=1:
n
j=j*2;
end
sum=sum+j;
j=1;
end
sum
(b)j=1;n=1;sum=1;
whilen~=64
i=1;
whileij=j*2;
i=i+1;
end
n=n+1;
sum=sum+j;
j=1;
end
Sum
(c)i=0:
63;k=sum(2.^i);
2计算1+2+…+n<2000时的最大n值
s=0;m=0;while(s<=2000),m=m+1;s=s+m;end,m
3用MATLAB语言实现下面的分段函数
存放于文件ff.m中,令D=3,h=1求出,f(-1.5),f(0.5),f(5).
D=3;h=1;
x=-2*D:
1/2:
2*D;
y=-h*(x<-D)+h/D./x.*((x>=-D)&(x<=D))+h*(x>D);
plot(x,y);
gridon
f1=y(find(x==-1.5))
f2=y(find(x==0.5))
f3=y(find(x==5))
实验三Matlab底层图形控制
1在MATLAB命令行中编程得到y=sin(t)和y1=cos(t)函数,plot(t,y);figure(10);plot(t,y1);
>>t=[-pi:
0.05:
pi];
>>y=sin(t);
>>y1=cos(t);
>>plot(t,y)
>>figure(10);
>>plot(t,y1)
2在MATLAB命令行中键入h=get(0),查看根屏幕的属性,h此时为根屏幕句柄的符号表示,0为根屏幕对应的标号。
>>h=get(0)
h=
BeingDeleted:
'off'
BusyAction:
'queue'
ButtonDownFcn:
''
CallbackObject:
[]
Children:
[2x1double]
Clipping:
'on'
CommandWindowSize:
[8927]
CreateFcn:
''
CurrentFigure:
1
DeleteFcn:
''
Diary:
'off'
DiaryFile:
'diary'
Echo:
'off'
FixedWidthFontName:
'CourierNew'
Format:
'short'
FormatSpacing:
'loose'
HandleVisibility:
'on'
HitTest:
'on'
Interruptible:
'on'
Language:
'zh_cn.gbk'
MonitorPositions:
[111440900]
More:
'off'
Parent:
[]
PointerLocation:
[1048463]
PointerWindow:
0
RecursionLimit:
500
ScreenDepth:
32
ScreenPixelsPerInch:
96
ScreenSize:
[111440900]
Selected:
'off'
SelectionHighlight:
'on'
ShowHiddenHandles:
'off'
Tag:
''
Type:
'root'
UIContextMenu:
[]
Units:
'pixels'
UserData:
[]
Visible:
'on'
3h1=get
(1);h2=get(10),1,10分别为两图形窗口对应标号,其中1为Matlab自动分配,标号10已在figure(10)中指定。
查看h1和h2属性,注意CurrentAxes和CurrenObject属性。
>>h1=get
(1)
h1=
Alphamap:
[1x64double]
BeingDeleted:
'off'
BusyAction:
'queue'
ButtonDownFcn:
''
Children:
170.0012
Clipping:
'on'
CloseRequestFcn:
'closereq'
Color:
[0.80000.80000.8000]
Colormap:
[64x3double]
CreateFcn:
''
CurrentAxes:
170.0012
CurrentCharacter:
''
CurrentObject:
[]
CurrentPoint:
[00]
DeleteFcn:
''
DockControls:
'on'
FileName:
''
FixedColors:
[10x3double]
HandleVisibility:
'on'
HitTest:
'on'
IntegerHandle:
'on'
Interruptible:
'on'
InvertHardcopy:
'on'
KeyPressFcn:
''
KeyReleaseFcn:
''
MenuBar:
'figure'
MinColormap:
64
Name:
''
NextPlot:
'add'
NumberTitle:
'on'
PaperOrientation:
'portrait'
PaperPosition:
[0.63456.345220.304615.2284]
PaperPositionMode:
'manual'
PaperSize:
[20.984029.6774]
PaperType:
'A4'
PaperUnits:
'centimeters'
Parent:
0
Pointer:
'arrow'
PointerShapeCData:
[16x16double]
PointerShapeHotSpot:
[11]
Position:
[440378560420]
Renderer:
'painters'
RendererMode:
'auto'
Resize:
'on'
ResizeFcn:
''
Selected:
'off'
SelectionHighlight:
'on'
SelectionType:
'normal'
Tag:
''
ToolBar:
'auto'
Type:
'figure'
UIContextMenu:
[]
Units:
'pixels'
UserData:
[]
Visible:
'on'
WindowButtonDownFcn:
''
WindowButtonMotionFcn:
''
WindowButtonUpFcn:
''
WindowKeyPressFcn:
''
WindowKeyReleaseFcn:
''
WindowScrollWheelFcn:
''
WindowStyle:
'normal'
WVisual:
'00(RGB32GDI,Bitmap,Window)'
WVisualMode:
'auto'
>>h2=get(10)
h2=
Alphamap:
[1x64double]
BeingDeleted:
'off'
BusyAction:
'queue'
ButtonDownFcn:
''
Children:
342.0011
Clipping:
'on'
CloseRequestFcn:
'closereq'
Color:
[0.80000.80000.8000]
Colormap:
[64x3double]
CreateFcn:
''
CurrentAxes:
342.0011
CurrentCharacter:
''
CurrentObject:
[]
CurrentPoint:
[00]
DeleteFcn:
''
DockControls:
'on'
FileName:
''
FixedColors:
[10x3double]
HandleVisibility:
'on'
HitTest:
'on'
IntegerHandle:
'on'
Interruptible:
'on'
InvertHardcopy:
'on'
KeyPressFcn:
''
KeyReleaseFcn:
''
MenuBar:
'figure'
MinColormap:
64
Name:
''
NextPlot:
'add'
NumberTitle:
'on'
PaperOrientation:
'portrait'
PaperPosition:
[0.63456.345220.304615.2284]
PaperPositionMode:
'manual'
PaperSize:
[20.984029.6774]
PaperType:
'A4'
PaperUnits:
'centimeters'
Parent:
0
Pointer:
'arrow'
PointerShapeCData:
[16x16double]
PointerShapeHotSpot:
[11]
Position:
[440378560420]
Renderer:
'painters'
RendererMode:
'auto'
Resize:
'on'
ResizeFcn:
''
Selected:
'off'
SelectionHighlight:
'on'
SelectionType:
'normal'
Tag:
''
ToolBar:
'auto'
Type:
'figure'
UIContextMenu:
[]
Units:
'pixels'
UserData:
[]
Visible:
'on'
WindowButtonDownFcn:
''
WindowButtonMotionFcn:
''
WindowButtonUpFcn:
''
WindowKeyPressFcn:
''
WindowKeyReleaseFcn:
''
WindowScrollWheelFcn:
''
WindowStyle:
'normal'
WVisual:
'00(RGB32GDI,Bitmap,Window)'
WVisualMode:
'auto'
4输入h.Children,观察结果。
>>h.Children
ans=
1
10
5键入gcf,得到当前图像句柄的值,分析其结果与h,h1,h2中哪个一致,为什么?
ans=
1
结果与h的一致
6鼠标点击Figure1窗口,让其位于前端,在命令行中键入gcf,观察此时的值,和上一步中有何不同,为什么?
ans=
1
7观察h1.Children和h2.Children,gca的值。
>>h1.Children
ans=
170.0012
>>h2.Children
ans=
342.0011
>>gca
ans=
170.0012
8观察以下程序结果h3=h1.Children;set(h3,'Color','green');h3_1=get(h3,'children');set(h3_1,'Color','red');其中h3_1为Figure1中线对象句柄,不能直接采用h3_1=h3.Children命令获得。
9命令行中键入plot(t,sin(t-pi/3)),观察曲线出现在哪个窗口。
h4=h2.Children;axes(h4);plot(t,sin(t-pi/3)),看看此时曲线显示在何窗口。
plot(t,sin(t-pi/3))后,曲线出现在figure1窗口;h4=h2.Children;axes(h4);plot(t,sin(t-pi/3))后,曲线出现在figure10
实验四控制系统古典分析
3.已知二阶系统
(1)编写程序求解系统的阶跃响应;
a=sqrt(10);
zeta=(1/a);
num=[10];
den=[12*zeta*a10];
sys=tf(num,den);
t=0:
0.01:
3;
figure
(1)
step(sys,t);grid
修改参数,实现
和
的阶跃响应;
时:
a=sqrt(10);
zeta=1;
num=[10];
den=[12*zeta*a10];
sys=tf(num,den);
t=0:
0.01:
3;
figure
(1)
step(sys,t);grid
时:
a=sqrt(10);
zeta=2;
num=[10];
den=[12*zeta*a10];
sys=tf(num,den);
t=0:
0.01:
3;
figure
(1)
step(sys,t);grid
修改参数,实现
和
的阶跃响应(
)
时:
a=sqrt(10);
zeta=(1/a);
num=[0.25];
den=[12*zeta*0.5*a0.25];
sys=tf(num,den);
t=0:
0.01:
3;
figure
(1)
step(sys,t);grid
时:
a=sqrt(10);
zeta=(1/a);
num=[40];
den=[12*zeta*2*a40];
sys=tf(num,den);
t=0:
0.01:
3;
figure
(1)
step(sys,t);grid
(2)试做出以下系统的阶跃响应,并比较与原系统响应曲线的差别与特点,作出相应的实验分析结果。
;
;
要求:
分析系统的阻尼比和无阻尼振荡频率对系统阶跃响应的影响;
分析响应曲线的零初值、非零初值与系统模型的关系;
分析响应曲线的稳态值与系统模型的关系;
分析系统零点对阶跃响应的影响;
a=sqrt(10);
zeta=(1/a);
num=[10];
den=[12*zeta*a10];
sys=tf(num,den);
t=0:
0.01:
3;
step(sys,t);
holdon
num1=[0210];
sys1=tf(num1,den);
step(sys1,t);
num2=[10.510];
sys2=tf(num2,den);
step(sys2,t);
num3=[10.50];
sys3=tf(num3,den);
step(sys3,t);
num4=[010];
sys4=tf(num4,den);
step(sys4,t);grid
5
已知
令k=1作Bode图,应用频域稳定判据确定系统的稳定性,并确定使系统获得最大相位裕度的增益k值。
G=tf([11],[0.1100]);
figure
(1)
margin(G);grid
实验五控制系统现代分析
1
(2)Bode图法判断系统稳定性:
已知两个单位负反馈系统的开环传递函数分别为:
用Bode图法判断系统闭环的稳定性。
G1=tf([2.7],[1540]);
figure
(1)
margin(G);grid
G2=tf([2.7],[15-40]);
figure
(2)
margin(G2);grid
2
系统能控性、能观性分析
已知连续系统的传递函数模型:
当α分别取-1,0,+1时,判别系统的能控性与能观性。
当α取-1时:
num=[1-1];
den=[1102718];
G=tf(num,den);
G1=ss(G)
a=[-10-3.375-2.25;800;010];
b=[0.5;0;0];
Uc=[b,a*b,a^2*b];
rank(Uc)
a=
x1x2x3
x1-10-3.375-2.25
x2800
x3010
b=
u1
x10.5
x20
x30
c=
x1x2x3
y100.25-0.25
d=
u1
y10
Continuous-timemodel.
rankUc=
3
rankUo=
3
由此,可以得到系统能控性矩阵Uc的秩是3,等于系统的维数,故系统是能控的。
能观性矩阵Uo的秩是3,等于系统的维数,故系统能观测的。
当α取0时:
a=
x1x2x3
x1-10-3.375-2.25
x2800
x3010
b=
u1
x10.25
x20
x30
c=
x1x2x3
y100.50
d=
u1
y10
Continuous-timemodel.
rankUc=
3
rankUo=
3
由此,可以得到系统能控性矩阵Uc的秩是3,等于系统的维数,故系统是能控的。
能观性矩阵Uo的秩是3,等于系统的维数,故系统能观测的。
当α取1时:
a=
x1x2x3
x1-10-3.375-2.25
x2800
x3010
b=
u1
x10.5
x20
x30
c=
x1x2x3
y100.250.25
d=
u1
y10
rankUc=
3
rankUo=
2
由此,可以得到系统能控性矩阵Uc的秩是3,等于系统的维数,故系统是能控的。
能观性矩阵Uo的秩是2,小于系统的维数,故系统不能观测的。
实验六PID控制器的设计
1.已知三阶对象模型
,利用MATLAB编写程序,研究闭环系统在不同控制情况下的阶跃响应,并分析结果。
(1)
时,在不同KP值下,闭环系统的阶跃响应;
s=tf('s');