LOGISTIC回归及SAS程序很全哦.docx
《LOGISTIC回归及SAS程序很全哦.docx》由会员分享,可在线阅读,更多相关《LOGISTIC回归及SAS程序很全哦.docx(14页珍藏版)》请在冰豆网上搜索。
LOGISTIC回归及SAS程序很全哦
使用条件:
⏹应变量Y是一个二值变量,取值为0和1
⏹自变量X1,X2,……,Xm。
⏹P表示在m个自变量作用下事件发生的概率。
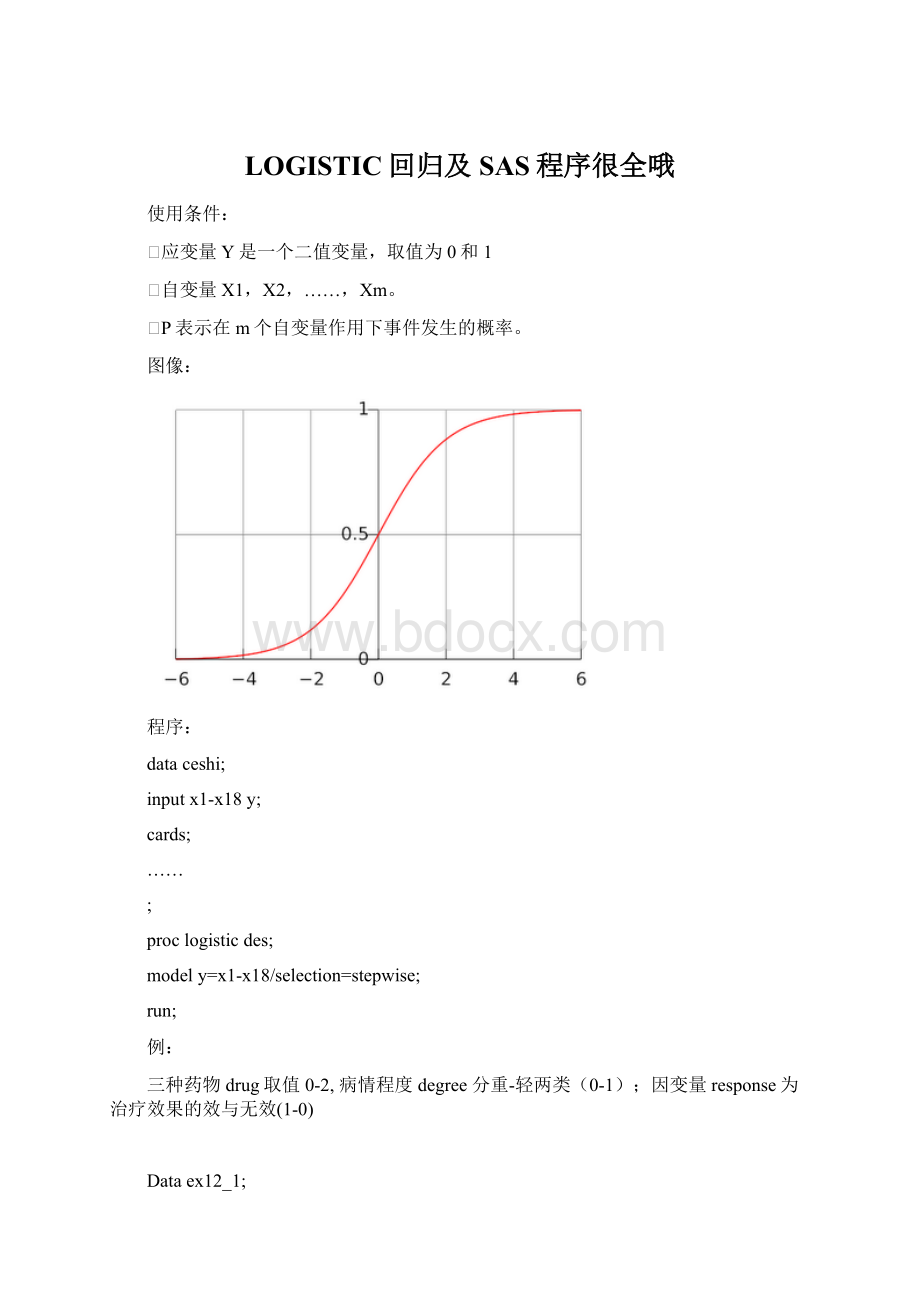
图像:
程序:
dataceshi;
inputx1-x18y;
cards;
……
;
proclogisticdes;
modely=x1-x18/selection=stepwise;
run;
例:
三种药物drug取值0-2,病情程度degree分重-轻两类(0-1);因变量response为治疗效果的效与无效(1-0)
Dataex12_1;
Inputdrugdegreeresponsecount;
Datalines;
01138
01064
00110
00082
11195
11018
10150
10035
21188
21026
20134
20037
;
Proclogisticdata=ex12_1descending;
Freqcount;
Classdrug/param=refdescending;
Modelresponse=drugdegree/rsqscale=naggregate;
Run;
Rsq显示R2
Scale,SCALE=specifiesmethodtocorrectoverdispersion,指定参数,=n表示不需要修正。
Aggregate计算卡方检验统计量
Class语句将分类变量化成虚拟变量,三种药用两个虚拟变量表示。
TheLOGISTICProcedure
ModelInformation
DataSetWORK.EX12_1
ResponseVariableresponse
NumberofResponseLevels2
FrequencyVariablecount
Modelbinarylogit
OptimizationTechniqueFisher'sscoring
NumberofObservationsRead12
NumberofObservationsUsed12
SumofFrequenciesRead577
SumofFrequenciesUsed577
ResponseProfile
OrderedTotal
ValueresponseFrequency
11315
20262
Probabilitymodeledisresponse=1.
ClassLevelInformation
Design
ClassValueVariables
drug210
101
000
ModelConvergenceStatus
Convergencecriterion(GCONV=1E-8)satisfied.
DevianceandPearsonGoodness-of-FitStatistics
CriterionValueDFValue/DFPr>ChiSq
Deviance0.374920.18740.8291
Pearson0.368920.18440.8316
模型拟合集优度检验,
Numberofuniqueprofiles:
6
ModelFitStatistics
Intercept
Interceptand
CriterionOnlyCovariates
AIC797.017641.326
SC801.375658.757
-2LogL795.017633.326
R-Square0.2444Max-rescaledR-Square0.3268
TheLOGISTICProcedure
TestingGlobalNullHypothesis:
BETA=0
TestChi-SquareDFPr>ChiSq
LikelihoodRatio161.69073<.0001
Score148.15983<.0001
Wald118.13943<.0001
检验模型全部系数为0,拒绝则模型有意义
Type3AnalysisofEffects
Wald
EffectDFChi-SquarePr>ChiSq
drug295.0859<.0001
degree147.4607<.0001
AnalysisofMaximumLikelihoodEstimates
StandardWald
ParameterDFEstimateErrorChi-SquarePr>ChiSq
Intercept1-1.95940.222977.2441<.0001
drug211.83420.240658.0936<.0001
drug112.28500.247984.9472<.0001
degree11.38060.200447.4607<.0001
参数估计与检验
OddsRatioEstimates
Point95%Wald
EffectEstimateConfidenceLimits
drug2vs06.2603.90610.033
drug1vs09.8266.04415.974
degree3.9772.6855.891
AssociationofPredictedProbabilitiesandObservedResponses
PercentConcordant72.2Somers'D0.568
PercentDiscordant15.4Gamma0.649
PercentTied12.4Tau-a0.282
Pairs82530c0.784
铸铁冶炼,要对铁加热heat和水中热处理(soakingtime),n表示铸铁块数,r表示没有准备好轧制的铁块数。
dataingots;
inputHeatSoakrn@@;
datalines;
71.0010141.0031271.0156511.0313
71.7017141.7043271.7444511.701
72.207142.2233272.2021512.201
72.8012142.8031272.8122514.001
74.009144.0019274.0116
;
proclogisticdata=ingots;
modelr/n=HeatSoak;
run;
TheLOGISTICProcedure
ModelInformation
DataSetWORK.INGOTS
ResponseVariable(Events)r
ResponseVariable(Trials)n
Modelbinarylogit
OptimizationTechniqueFisher'sscoring
实验次数n,事件发生次数r
NumberofObservationsRead19
NumberofObservationsUsed19
SumofFrequenciesRead387
SumofFrequenciesUsed387
ResponseProfile
OrderedBinaryTotal
ValueOutcomeFrequency
1Event12
2Nonevent375
响应变量分析,发生12次,不发生375次。
ModelConvergenceStatus
Convergencecriterion(GCONV=1E-8)satisfied.
ModelFitStatistics
Intercept
Interceptand
CriterionOnlyCovariates
AIC108.988101.346
SC112.947113.221
-2LogL106.98895.346
用于选择最优级模型,越小越优级
TestingGlobalNullHypothesis:
BETA=0
TestChi-SquareDFPr>ChiSq
LikelihoodRatio11.642820.0030
Score15.109120.0005
Wald13.031520.0015
模型检验
似然比检验(likelihoodratiotest)、计分检验(scoretest)、Wald检验(Waldtest)三种
AnalysisofMaximumLikelihoodEstimates
StandardWald
ParameterDFEstimateErrorChi-SquarePr>ChiSq
Intercept1-5.55921.119724.6503<.0001
Heat10.08200.023711.94540.0005
Soak10.05680.33120.02940.8639
系数检验
OddsRatioEstimates
Point95%Wald
EffectEstimateConfidenceLimits
Heat1.0851.0361.137
Soak1.0580.5532.026
TheLOGISTICProcedure
AssociationofPredictedProbabilitiesandObservedResponses
PercentConcordant64.4Somers'D0.460
PercentDiscordant18.4Gamma0.555
PercentTied17.2Tau-a0.028
Pairs4500c0.730
Usingtheparameterestimates,youcancalculatetheestimatedlogitofas
Logit(p)=log(p/1-p)=-5.5592+0.082×Heat+0.0568×Soak
IfHeat=7andSoak=1,thenlogit(p)=-4.92584.Usingthislogitestimate,youcancalculateasfollows:
P=1/(1+e4.9284)=0.0072
Y表示骑车上班(Y=1bike,Y=0,BUS),X1年龄,X2月收入,X3性别(1男,0女)
X3
X1
X2
y
0
18
850
0
0
21
1200
0
0
23
850
1
0
23
950
1
0
28
1200
1
0
31
850
0
0
36
1500
1
0
42
1000
1
0
46
950
1
0
48
1200
0
0
55
1800
1
0
56
2100
1
0
58
1800
1
1
18
850
0
1
20
1000
0
1
25
1200
0
1
27
1300
0
1
28
1500
0
1
30
950
1
1
32
1000
0
1
33
1800
0
1
33
1000
0
1
38
1200
0
1
41
1500
0
1
45
1800
1
1
48
1000
0
1
52
1500
1
1
56
1800
1
Datap256;
InputX3X1X2y;
Datalines;
0188500
02112000
0238501
0239501
02812001
0318500
03615001
04210001
0469501
04812000
05518001
05621001
05818001
1188500
12010000
12512000
12713000
12815000
1309501
13210000
13318000
13310000
13812000
14115000
14518001
14810000
15215001
15618001
;
Proclogisticdata=p256descending;
Modely=x1-x3;
outputout=predp=phatlower=lclupper=ucl
predprobs=(individualcrossvalidate);
run;
procprintdata=pred;
run;
TheLOGISTICProcedure
ModelInformation
DataSetWORK.P256
ResponseVariabley
NumberofResponseLevels2
Modelbinarylogit
OptimizationTechniqueFisher'sscoring
NumberofObservationsRead28
NumberofObservationsUsed28
ResponseProfile
OrderedTotal
ValueyFrequency
1015
2113
Probabilitymodeledisy=0.
ModelConvergenceStatus
Convergencecriterion(GCONV=1E-8)satisfied.
ModelFitStatistics
Intercept
Interceptand
CriterionOnlyCovariates
AIC40.67333.971
SC42.00539.299
-2LogL38.67325.971
TestingGlobalNullHypothesis:
BETA=0
TestChi-SquareDFPr>ChiSq
LikelihoodRatio12.702630.0053
Score10.413530.0154
Wald6.533130.0884
AnalysisofMaximumLikelihoodEstimates
StandardWald
ParameterDFEstimateErrorChi-SquarePr>ChiSq
Intercept13.65472.09113.05450.0805
X11-0.08220.05212.48530.1149
X21-0.001520.001870.66130.4161
X312.50161.15784.66890.0307
TheLOGISTICProcedure
OddsRatioEstimates
Point95%Wald
EffectEstimateConfidenceLimits
X10.9210.8321.020
X20.9980.9951.002
X312.2031.262118.014
AssociationofPredictedProbabilitiesandObservedResponses
PercentConcordant87.2Somers'D0.744
PercentDiscordant12.8Gamma0.744
PercentTied0.0Tau-a0.384
Pairs195c0.872
序号
样品数W
其中有房屋数
收入(千元)
1
10.0
1.5
2.0
2
20.0
3.2
3.0
3
25.0
4.0
4.0
4
30.0
5.0
5.0
5
40.0
8.0
6.0
6
50.0
12.0
8.0
7
60.0
18.0
10.0
8
80.0
28.0
13.0
9
100.0
45.0
15.0
10
70.0
36.0
20.0
11
65.0
39.0
25.0
12
50.0
33.0
30.0
13
40.0
30.0
35.0
14
25.0
20.0
40.0
15
30.0
27.0
50.0
16
40.0
38.0
60.0
17
50.0
48.0
70.0
18
60.0
58.0
80.0
Dataex1;
Inputnonn1x;
Datalines;
110.01.52.0
220.03.23.0
325.04.04.0
430.05.05.0
540.08.06.0
650.012.08.0
760.018.010.0
880.028.013.0
9100.045.015.0
1070.036.020.0
1165.039.025.0
1250.033.030.0
1340.030.035.0
1425.020.040.0
1530.027.050.0
1640.038.060.0
1750.048.070.0
1860.058.080.0
;
Proclogisticdata=ex1;
Modeln1/n=x;
Run;
 升级会员
升级会员 