最新版spss实验报告17778.docx
《最新版spss实验报告17778.docx》由会员分享,可在线阅读,更多相关《最新版spss实验报告17778.docx(20页珍藏版)》请在冰豆网上搜索。

最新版spss实验报告17778
Spss实验报告
(一)
班级:
管理1102
姓名:
禹龙
学号:
一、逻辑回归:
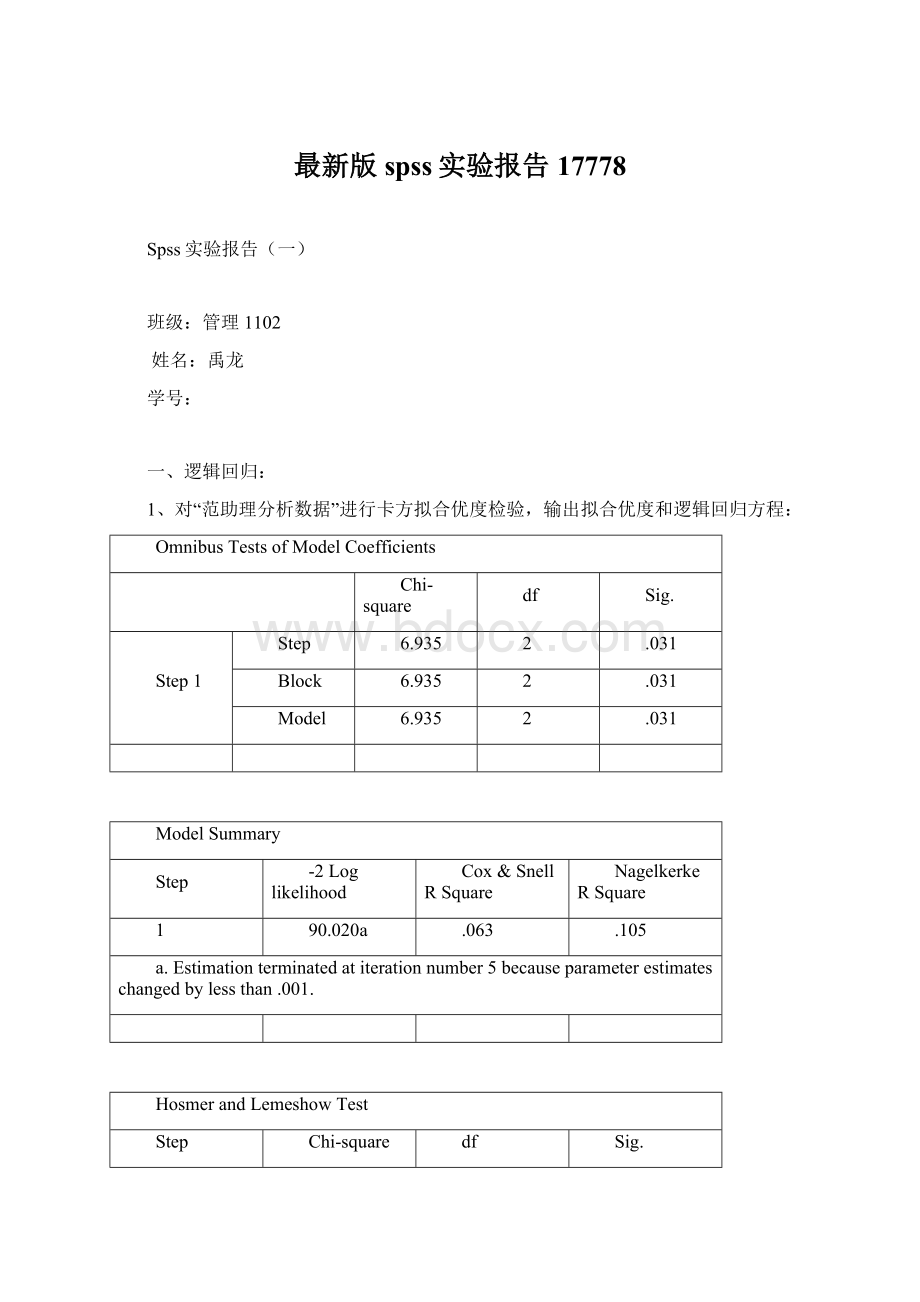
1、对“范助理分析数据”进行卡方拟合优度检验,输出拟合优度和逻辑回归方程:
OmnibusTestsofModelCoefficients
Chi-square
df
Sig.
Step1
Step
6.935
2
.031
Block
6.935
2
.031
Model
6.935
2
.031
ModelSummary
Step
-2Loglikelihood
Cox&SnellRSquare
NagelkerkeRSquare
1
90.020a
.063
.105
a.Estimationterminatedatiterationnumber5becauseparameterestimateschangedbylessthan.001.
HosmerandLemeshowTest
Step
Chi-square
df
Sig.
1
13.713
8
.090
ContingencyTableforHosmerandLemeshowTest
购买行为=0
购买行为=1
Total
Observed
Expected
Observed
Expected
Step1
1
11
10.487
0
.513
11
2
8
10.168
3
.832
11
3
11
9.943
0
1.057
11
4
9
9.737
2
1.263
11
5
10
9.484
1
1.516
11
6
11
9.143
0
1.857
11
7
9
7.957
1
2.043
10
8
8
9.291
4
2.709
12
9
7
8.628
5
3.372
12
10
5
4.161
2
2.839
7
ClassificationTablea
Observed
Predicted
购买行为
PercentageCorrect
0
1
Step1
购买行为
0
89
0
100.0
1
17
1
5.6
OverallPercentage
84.1
a.Thecutvalueis.500
VariablesintheEquation
B
S.E.
Wald
df
Sig.
Exp(B)
Step1a
炫耀动机
1.102
.450
6.005
1
.014
3.011
自我善待动机
-.508
.395
1.657
1
.198
.601
Constant
-3.109
1.204
6.668
1
.010
.045
a.Variable(s)enteredonstep1:
炫耀动机,自我善待动机.
回归拟合方程:
或者:
分析报告:
A、炫耀动机每增加一个单位,优势比增加3.011倍
B、自我善待动机每增加一个单位,优势比增加0.601倍
2、对范助理分析数据进行多元线性回归分析:
(1)假设
(2)回归方程及其含义:
Coefficientsa
Model
UnstandardizedCoefficients
StandardizedCoefficients
t
Sig.
Correlations
B
Std.Error
Beta
Zero-order
Partial
Part
1
(Constant)
1.173
.340
3.447
.001
炫耀动机
.272
.125
.222
2.172
.032
.457
.208
.177
自我善待动机
.464
.122
.390
3.813
.000
.524
.350
.311
a.DependentVariable:
意愿
回归方程:
(3.447)(2.172)(3.813)
含义:
A、在其他情况不变的情况下,炫耀动机每增加1000个单位,购买意愿就会平均增加272个单位。
B、在其他情况不变的情况下,自我善待动机每增加1000个单位,购买意愿就会平均增加464个单位。
(3)方程及系数性检验:
ANOVAa
Model
SumofSquares
df
MeanSquare
F
Sig.
1
Regression
33.662
2
16.831
22.958
.000b
Residual
76.245
104
.733
Total
109.907
106
a.DependentVariable:
意愿
b.Predictors:
(Constant),自我善待动机,炫耀动机
Coefficientsa
Model
UnstandardizedCoefficients
StandardizedCoefficients
t
Sig.
Correlations
B
Std.Error
Beta
Zero-order
Partial
Part
1
(Constant)
1.173
.340
3.447
.001
炫耀动机
.272
.125
.222
2.172
.032
.457
.208
.177
自我善待动机
.464
.122
.390
3.813
.000
.524
.350
.311
a.DependentVariable:
意愿
A、该数据拟合优度,表明购买意愿变异的55.3%可以通过炫耀动机和自我善待动机两个变量来解释。
B、F=22.958,P<0.001,说明所有系数为0的假设()被拒绝,即方程存在显著的线性关系。
C、所有变量回归系数的t值所对应的显著性概率P<0.05,表示所有的回归系数均是显著的。
(4)、回归方程的基本假设检验:
ModelSummaryb
Model
R
RSquare
AdjustedRSquare
Std.ErroroftheEstimate
ChangeStatistics
RSquareChange
FChange
df1
df2
Sig.FChange
1
.553a
.306
.293
.85623
.306
22.958
2
104
.000
a.Predictors:
(Constant),自我善待动机,炫耀动机
b.DependentVariable:
意愿
Correlations
意愿
炫耀动机
自我善待动机
PearsonCorrelation
意愿
1.000
.457
.524
炫耀动机
.457
1.000
.603
自我善待动机
.524
.603
1.000
Sig.(1-tailed)
意愿
.
.000
.000
炫耀动机
.000
.
.000
自我善待动机
.000
.000
.
N
意愿
107
107
107
炫耀动机
107
107
107
自我善待动机
107
107
107
由上图可以看出:
A、DW=1.436,表明残差不存在自相关。
B、标准残差的绝对值与自变量不存在显著的相关关系,表明残差不具有异方差性。
C、残差的直方图和P-P图显示,残差基本符合标准正态分布。
二、因子分析:
KMOandBartlett'sTest
Kaiser-Meyer-OlkinMeasureofSamplingAdequacy.
.723
Bartlett'sTestofSphericity
Approx.Chi-Square
678.796
df
66
Sig.
.000
KMO系数大于0.7,χ2=678.796,p=0.000,说明该组数据适合做因子分析。
Communalities
Initial
Extraction
x1
1.000
.898
x2
1.000
.864
x3
1.000
.843
x4
1.000
.825
x5
1.000
.934
x6
1.000
.974
x7
1.000
.934
x8
1.000
.971
x9
1.000
.748
x10
1.000
.867
x11
1.000
.921
x12
1.000
.675
ExtractionMethod:
PrincipalComponentAnalysis.
RotatedComponentMatrixa
Component
1
2
3
x6
.970
.174
x8
.952
.199
-.155
x7
.947
-.191
x5
.934
.194
.155
x1
.929
-.183
x3
.870
-.147
.253
x2
.806
.309
.344
x4
.791
-.437
x11
.921
.259
x10
.914
.175
x12
.809
-.106
x9
.205
.840
Undefinederror#11401-Cannotopentextfile"D:
\PROGRA~1\IBM\SPSS\STATIS~1\22\lang\en\spss.err":
Undefinederror#11408-Cannotopentextfile"D:
\PROGRA~1\IBM\SPSS\STATIS~1\22\lang\en\spss.err":
a.Rotationconvergedin4iterations.
TotalVarianceExplained
Component
InitialEigenvalues
ExtractionSumsofSquaredLoadings
RotationSumsofSquaredLoadings
Total
%ofVariance
Cumulative%
Total
%ofVariance
Cumulative%
Total
%ofVariance
Cumulative%
1
6.671
55.589
55.589
6.671
55.589
55.589
6.526
54.381
54.381
2
2.675
22.293
77.882
2.675
22.293
77.882
2.649
22.077
76.458
3
1.107
9.224
87.105
1.107
9.224
87.105
1.278
10.647
87.105
4
.670
5.581
92.686
5
.437
3.642
96.329
6
.229
1.909
98.238
7
.076
.631
98.869
8
.073
.612
99.482
9
.032
.264
99.746
10
.021
.179
99.925
11
.007
.056
99.981
12
.002
.019
100.000
ExtractionMethod:
PrincipalComponentAnalysis.
本次分析特征值大于1的因素共有3个,第三个因素只包含两个题项:
x9和x4,层面所覆盖的题项内容太少,因此尝试删除;通过对公因子方差的比较,x9小于x4,因此先删除x9.
删除x9后:
KMOandBartlett'sTest
Kaiser-Meyer-OlkinMeasureofSamplingAdequacy.
.741
Bartlett'sTestofSphericity
Approx.Chi-Square
674.816
df
55
Sig.
.000
KMO值为0.741,变量间的相关性较强,所以可以做因子分析。
χ2=674.816,达到显著,表示样本的相关矩阵间有共同因素存在,适合进行因子分析。
RotatedComponentMatrixa
Component
1
2
x6
.970
.173
x8
.956
.173
x7
.954
x1
.928
-.154
x5
.926
.239
x3
.860
x4
.807
x2
.789
.399
x11
.957
x10
.931
x12
.779
Undefinederror#11401-Cannotopentextfile"D:
\PROGRA~1\IBM\SPSS\STATIS~1\22\lang\en\spss.err":
Undefinederror#11408-Cannotopentextfile"D:
\PROGRA~1\IBM\SPSS\STATIS~1\22\lang\en\spss.err":
a.Rotationconvergedin3iterations.
Communalities
Initial
Extraction
x1
1.000
.885
x2
1.000
.781
x3
1.000
.743
x4
1.000
.652
x5
1.000
.914
x6
1.000
.970
x7
1.000
.910
x8
1.000
.944
x10
1.000
.866
x11
1.000
.918
x12
1.000
.615
ExtractionMethod:
PrincipalComponentAnalysis.
TotalVarianceExplained
Component
InitialEigenvalues
ExtractionSumsofSquaredLoadings
RotationSumsofSquaredLoadings
Total
%ofVariance
Cumulative%
Total
%ofVariance
Cumulative%
Total
%ofVariance
Cumulative%
1
6.668
60.616
60.616
6.668
60.616
60.616
6.506
59.148
59.148
2
2.531
23.009
83.625
2.531
23.009
83.625
2.692
24.477
83.625
3
.848
7.713
91.338
4
.509
4.628
95.966
5
.229
2.083
98.049
6
.076
.689
98.738
7
.076
.687
99.425
8
.032
.292
99.717
9
.022
.196
99.913
10
.007
.065
99.978
11
.002
.022
100.000
ExtractionMethod:
PrincipalComponentAnalysis.
由上表和碎石图可以看出前两个特征值较大,其余九个特征值均较小。
前两个公公因子对样本方差的贡献率和为86.625%。
三、信度分析:
(1)、总量表信度系数
ReliabilityStatistics
Cronbach'sAlpha
NofItems
.590
11
Item-TotalStatistics
ScaleMeanifItemDeleted
ScaleVarianceifItemDeleted
CorrectedItem-TotalCorrelation
SquaredMultipleCorrelation
Cronbach'sAlphaifItemDeleted
x1
.8646
4641.000
.796
.973
.596
x2
.0706
571.250
.820
.957
.390
x3
.4454
7795.000
.822
.900
.595
x4
.4977
5210.000
.638
.981
.596
x5
.9277
6401.000
.977
.975
.546
x6
.8134
996.300
.857
.988
.278
x7
.0597
8029.000
.808
.991
.596
x8
.0991
2247.000
.888
.996
.541
x10
.8209
1777.000
.280
.894
.596
x11
.1000
9862.000
.338
.876
.596
x12
.4351
4138.000
.291
.714
.596
分析:
信度系数为0.590,说明说明总量表的内在信度不高。
(2)“社会经济指标”维度层面的信度系数
ReliabilityStatistics
Cronbach'sAlpha
Cronbach'sAlphaBasedonStandardizedItems
NofItems
.613
.968
8
Item-TotalStatistics
ScaleMeanifItemDeleted
ScaleVarianceifItemDeleted
CorrectedItem-TotalCorrelation
SquaredMultipleCorrelation
Cronbach'sAlphaifItemDeleted
x1
.5803
7935.000
.796
.954
.626
x2
.7863
194.800
.820
.952
.410
x3
.1611
8019.000
.822
.873
.625
x4
.2134
0269.000
.638
.973
.626
x5
.6434
6899.000
.977
.971
.574
x6
.5291
230.400
.857
.987
.292
x7
.7754
3787.000
.808
.983
.626
x8
.8149
9818.000
.888
.994
.568
分析:
信度系数为0.613,说明“社会经济指标”维度层面的内在信度不高。
(3)“城市公共设施水平指标”维度层面的信度系数
ReliabilityStatistics
Cronbach'sAlpha
Cronbach'sAlphaBasedonStandardizedItems
NofItems
.605
.877
3
Item-TotalStatistics
ScaleMeanifItemDeleted
ScaleVarianceifItemDeleted
CorrectedItem-TotalCorrelation
SquaredMultipleCorrelation
Cronbach'sAlphaifItemDeleted
x10
46.8917
2290.719
.644
.835
.341
x11
51.1709
3051.671
.791
.855
.574
x12
22.5060
617.282
.593
.400
.771
分析:
信度系数为0.605,说明“城市公共设施水平指标”维度层面的内在信度不高。
4、综合评价:
TotalVarianceExplained
Component
InitialEigenvalues
ExtractionSumsofSquaredLoadings
RotationSumsofSquaredLoadings
Total
%ofVariance
Cumulative%
Total
%ofVariance
Cumulative%
Total
%ofVariance
Cumulative%
1
6.668
60.616
60.616
6.668
60.616
60.616
6.506
59.148
59.148
2
2.531
23.009
83.625
2.531
23.009
83.625
2.692
24.477
83.625
3
.848
7.713
91.338
4
.509
4.628
95.966
5
.229
2.083
98.049
6
.076
.689
98.738
7
.076
.687
99.425
8
.032
.292
99.717
9
.022
.196
99.913
10
.007
.065
99.978