chap02TIFBSAFC5.docx
《chap02TIFBSAFC5.docx》由会员分享,可在线阅读,更多相关《chap02TIFBSAFC5.docx(53页珍藏版)》请在冰豆网上搜索。
chap02TIFBSAFC5
CHAPTER2:
PRESENTINGDATAINTABLESANDCHARTS
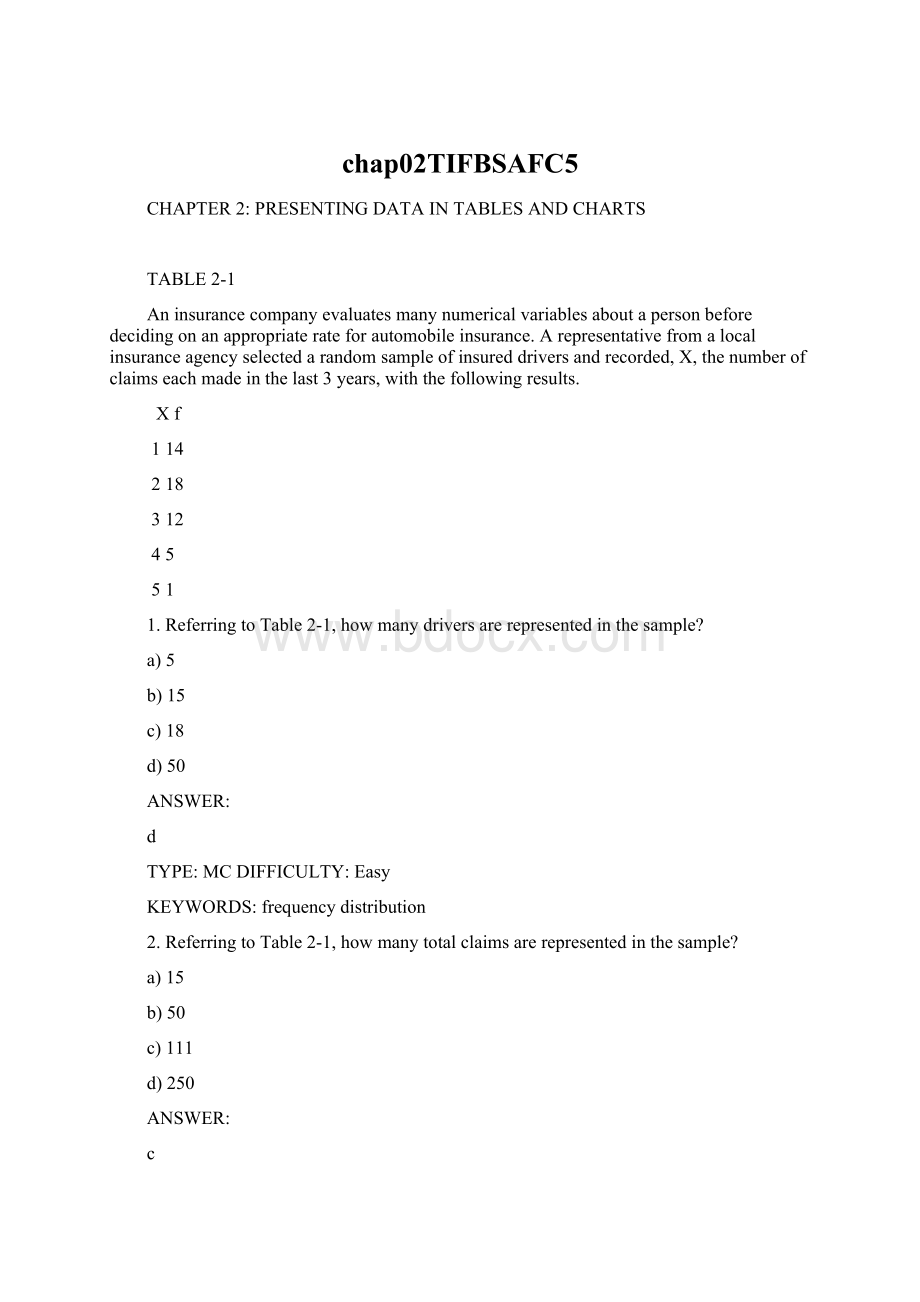
TABLE2-1
Aninsurancecompanyevaluatesmanynumericalvariablesaboutapersonbeforedecidingonanappropriaterateforautomobileinsurance.Arepresentativefromalocalinsuranceagencyselectedarandomsampleofinsureddriversandrecorded,X,thenumberofclaimseachmadeinthelast3years,withthefollowingresults.
Xf
114
218
312
45
51
1.ReferringtoTable2-1,howmanydriversarerepresentedinthesample?
a)5
b)15
c)18
d)50
ANSWER:
d
TYPE:
MCDIFFICULTY:
Easy
KEYWORDS:
frequencydistribution
2.ReferringtoTable2-1,howmanytotalclaimsarerepresentedinthesample?
a)15
b)50
c)111
d)250
ANSWER:
c
TYPE:
MCDIFFICULTY:
Moderate
KEYWORDS:
interpretation,frequencydistribution
3.Atypeofverticalbarchartinwhichthecategoriesareplottedinthedescendingrankorderofthemagnitudeoftheirfrequenciesiscalleda
a)contingencytable.
b)Paretodiagram.
c)dotplot.
d)piechart.
ANSWER:
b
TYPE:
MCDIFFICULTY:
Easy
KEYWORDS:
Paretodiagram
TABLE2-2
Atameetingofinformationsystemsofficersforregionalofficesofanationalcompany,asurveywastakentodeterminethenumberofemployeestheofficerssuperviseintheoperationoftheirdepartments,whereXisthenumberofemployeesoverseenbyeachinformationsystemsofficer.
Xf_
17
25
311
48
59
4.ReferringtoTable2-2,howmanyregionalofficesarerepresentedinthesurveyresults?
a)5
b)11
c)15
d)40
ANSWER:
d
TYPE:
MCDIFFICULTY:
Easy
KEYWORDS:
interpretation,frequencydistribution
5.ReferringtoTable2-2,acrossalloftheregionaloffices,howmanytotalemployeesweresupervisedbythosesurveyed?
a)15
b)40
c)127
d)200
ANSWER:
c
TYPE:
MCDIFFICULTY:
Moderate
KEYWORDS:
interpretation,frequencydistribution
6.Thewidthofeachbarinahistogramcorrespondstothe
a)differencesbetweentheboundariesoftheclass.
b)numberofobservationsineachclass.
c)midpointofeachclass.
d)percentageofobservationsineachclass.
ANSWER:
a
TYPE:
MCDIFFICULTY:
Easy
KEYWORDS:
frequencydistribution
TABLE2-3
Everyspringsemester,theSchoolofBusinesscoordinateswithlocalbusinessleadersaluncheonforgraduatingseniors,theirfamilies,andfriends.Corporatesponsorshippaysforthelunchesofeachoftheseniors,butstudentshavetopurchaseticketstocoverthecostoflunchesservedtogueststheybringwiththem.Thefollowinghistogramrepresentstheattendanceattheseniorluncheon,whereXisthenumberofguestseachgraduatingseniorinvitedtotheluncheonandfisthenumberofgraduatingseniorsineachcategory.
7.ReferringtothehistogramfromTable2-3,howmanygraduatingseniorsattendedtheluncheon?
a)4
b)152
c)275
d)388
ANSWER:
c
TYPE:
MCDIFFICULTY:
Difficult
EXPLANATION:
Thenumberofgraduatingseniorsisthesumofallthefrequencies,f.
KEYWORDS:
interpretation,histogram
8.ReferringtothehistogramfromTable2-3,ifalltheticketspurchasedwereused,howmanyguestsattendedtheluncheon?
a)4
b)152
c)275
d)388
ANSWER:
d
TYPE:
MCDIFFICULTY:
Difficult
EXPLANATION:
Thetotalnumberofguestsis
KEYWORDS:
interpretation,histogram
9.AprofessorofeconomicsatasmallTexasuniversitywantedtodeterminewhatyearinschoolstudentsweretakinghistougheconomicscourse.Shownbelowisapiechartoftheresults.Whatpercentageoftheclasstookthecoursepriortoreachingtheirsenioryear?
a)14%
b)44%
c)54%
d)86%
ANSWER:
d
TYPE:
MCDIFFICULTY:
Easy
KEYWORDS:
interpretation,piechart
10.Whenpolygonsorhistogramsareconstructed,whichaxismustshowthetruezeroor"origin"?
a)Thehorizontalaxis.
b)Theverticalaxis.
c)Boththehorizontalandverticalaxes.
d)Neitherthehorizontalnortheverticalaxis.
ANSWER:
b
TYPE:
MCDIFFICULTY:
Easy
KEYWORDS:
polygon,histogram
11.Whenconstructingcharts,thefollowingisplottedattheclassmidpoints:
a)frequencyhistograms.
b)percentagepolygons.
c)cumulativerelativefrequencyogives.
d)Alloftheabove.
ANSWER:
b
TYPE:
MCDIFFICULTY:
Easy
KEYWORDS:
percentagepolygon
TABLE2-4
Asurveywasconductedtodeterminehowpeopleratedthequalityofprogrammingavailableontelevision.Respondentswereaskedtoratetheoverallqualityfrom0(noqualityatall)to100(extremelygoodquality).Thestem-and-leafdisplayofthedataisshownbelow.
StemLeaves
324
403478999
50112345
612566
701
8
92
12.ReferringtoTable2-4,whatpercentageoftherespondentsratedoveralltelevisionqualitywitharatingof80orabove?
a)0
b)4
c)96
d)100
ANSWER:
b
TYPE:
MCDIFFICULTY:
Easy
KEYWORDS:
stem-and-leafdisplay,interpretation
13.ReferringtoTable2-4,whatpercentageoftherespondentsratedoveralltelevisionqualitywitharatingof50orbelow?
a)11
b)40
c)44
d)56
ANSWER:
c
TYPE:
MCDIFFICULTY:
Moderate
KEYWORDS:
stem-and-leafdisplay,interpretation
14.ReferringtoTable2-4,whatpercentageoftherespondentsratedoveralltelevisionqualitywitharatingbetween50and75?
a)11
b)40
c)44
d)56
ANSWER:
d
TYPE:
MCDIFFICULTY:
Moderate
KEYWORDS:
stem-and-leafdisplay,interpretation
TABLE2-5
Thefollowingarethedurationsinminutesofasampleoflong-distancephonecallsmadewithinthecontinentalUnitedStatesreportedbyonelong-distancecarrier.
Relative
Time(inMinutes)Frequency
0butlessthan50.37
5butlessthan100.22
10butlessthan150.15
15butlessthan200.10
20butlessthan250.07
25butlessthan300.07
30ormore0.02
15.ReferringtoTable2-5,whatisthewidthofeachclass?
a)1minute
b)5minutes
c)2%
d)100%
ANSWER:
b
TYPE:
MCDIFFICULTY:
Easy
KEYWORDS:
classinterval,relativefrequencydistribution
16.ReferringtoTable2-5,if1,000callswererandomlysampled,howmanycallslastedunder10minutes?
a)220
b)370
c)410
d)590
ANSWER:
d
TYPE:
MCDIFFICULTY:
Moderate
KEYWORDS:
relativefrequencydistribution,interpretation
17.ReferringtoTable2-5,if100callswererandomlysampled,howmanycallslasted15minutesorlonger?
a)10
b)14
c)26
d)74
ANSWER:
c
TYPE:
MCDIFFICULTY:
Moderate
KEYWORDS:
relativefrequencydistribution,interpretation
18.ReferringtoTable2-5,if10callslasted30minutesormore,howmanycallslastedlessthan5minutes?
a)10
b)185
c)295
d)500
ANSWER:
b
TYPE:
MCDIFFICULTY:
Moderate
KEYWORDS:
relativefrequencydistribution,interpretation
19.ReferringtoTable2-5,whatisthecumulativerelativefrequencyforthepercentageofcallsthatlastedunder20minutes?
a)0.10
b)0.59
c)0.76
d)0.84
ANSWER:
d
TYPE:
MCDIFFICULTY:
Easy
KEYWORDS:
cumulativerelativefrequency
20.ReferringtoTable2-5,whatisthecumulativerelativefrequencyforthepercentageofcallsthatlasted10minutesormore?
a)0.16
b)0.24
c)0.41
d)0.90
ANSWER:
c
TYPE:
MCDIFFICULTY:
Moderate
KEYWORDS:
cumulativerelativefrequency
21.ReferringtoTable2-5,if100callswererandomlysampled,_______ofthemwouldhavelastedatleast15minutesbutlessthan20minutes
a)0.10
b)0.16
c)10
d)16
ANSWER:
c
TYPE:
MCDIFFICULTY:
Easy
KEYWORDS:
relativefrequencydistribution,interpretation
22.ReferringtoTable2-5,if100callsweresampled,_______ofthemwouldhavelastedlessthan15minutes.
a)26
b)74
c)10
d)Noneoftheabove.
ANSWER:
b
TYPE:
MCDIFFICULTY:
Moderate
KEYWORDS:
relativefrequencydistribution,interpretation
23.ReferringtoTable2-5,if100callsweresampled,_______ofthemwouldhavelasted20minutesormore.
a)26
b)16
c)74
d)Noneoftheabove.
ANSWER:
b
TYPE:
MCDIFFICULTY:
Moderate
KEYWORDS:
relativefrequencydistribution,interpretation
24.ReferringtoTable2-5,if100callsweresampled,_______ofthemwouldhavelastedlessthan5minutesoratleast30minutesormore.
a)35
b)37
c)39
d)Noneoftheabove.
ANSWER:
c
TYPE:
MCDIFFICULTY:
Difficult
KEYWORDS:
relativefrequencydistribution,interpretation
25.Whenstudyingthesimultaneousresponsestotwocategoricalquestions,weshouldsetupa
a)contingencytable.
b)frequencydistributiontable.
c)cumulativepercentagedistributiontable.
d)histogram.
ANSWER:
a
TYPE:
MCDIFFICULTY:
Easy
KEYWORDS:
contingencytable
26.Dataon1,500students’heightwerecollectedatalargeruniversityintheEastCoast.Whichofthefollowingisthebestchartforpresentingtheinformation?
a)Apiechart.
b)AParetodiagram.
c)Ascatterplot.
d)Ahistogram.
ANSWER:
d
TYPE:
MCDIFFICULTY:
Easy
KEYWORDS:
choiceofchart,histogram
27.Dataonthenumberofpart-timehoursstudentsatapublicuniversityworkedinaweekwerecollected.Whichofthefollowingisthebestchartforpresentingtheinformation?
a)Apiechart.
b)AParetodiagram.
c)Apercentagetable.
d)Apercentagepolygon.
ANSWER:
d
TYPE:
MCDIFFICULTY:
Easy
KEYWORDS:
choiceofchart,percentagepolygon
28.Dataonthenumberofcredithoursof20,000studentsatapublicuniversityenrolledinaSpringsemesterwerecollected.Whichofthefollowingisthebestforpresentingtheinformation?
a)Apiechart.
b)AParetodiagram.
c)Astem-and-leafdisplay.
d)Acontingencytable.
ANSWER:
c
TYPE:
MCDIFFICULTY:
Easy
KEYWORDS:
choiceofchart,stem-and-leaf
29.Asurveyof150executiveswereaskedwhattheythinkisthemostcommonmistakecandidatesmakeduringjobinterviews.Sixdifferentmistakesweregiven.Whichofthefollowingisthebestforpresentingtheinformation?
a)Abarchart.
b)Ahistogram
c)Astem-and-leafdisplay.
d)Acontingencytable.
ANSWER:
a
TYPE:
MCDIFFICULTY:
Ea
 升级会员
升级会员 