Lecture 12 Chapter 8 Inference for proportions12讲8章推理的比例.docx
《Lecture 12 Chapter 8 Inference for proportions12讲8章推理的比例.docx》由会员分享,可在线阅读,更多相关《Lecture 12 Chapter 8 Inference for proportions12讲8章推理的比例.docx(10页珍藏版)》请在冰豆网上搜索。

Lecture12Chapter8Inferenceforproportions12讲8章推理的比例
Lecture12,Section8.1&8.2
Proportions
Manystatisticalstudiesproducecountsratherthanmeasurements.
Example:
Didyouvoteinthelastelection?
Theresponsewouldbeeithera“Yes”ora“No”.Thevariableiscategorical,theresponseisthevaluethevariabletakesonforeachunit/person.IfIdidasurveyofthisclass,Icouldaccumulatethecountof“Yes”responsesanddescribethiscountasaproportionofthetotal.
Example:
WhatacademicyearareyouinatPurdue.Theresponsewouldbeeither“Freshman”,“Sophomore”,“Junior”,or“Senior”.Again,Icouldaccumulatethecountofeachanddescribeeachasaproportionofthetotal.
PopulationandSampleproportions:
Instatisticalsamplingweoftenwanttoestimatetheproportion,p,of“successes”inapopulation.“Success”iswhenthecategoricalvariabletakesononeparticularvalue.
p=countofsuccessesinpopulation
sizeofpopulation
=X/N
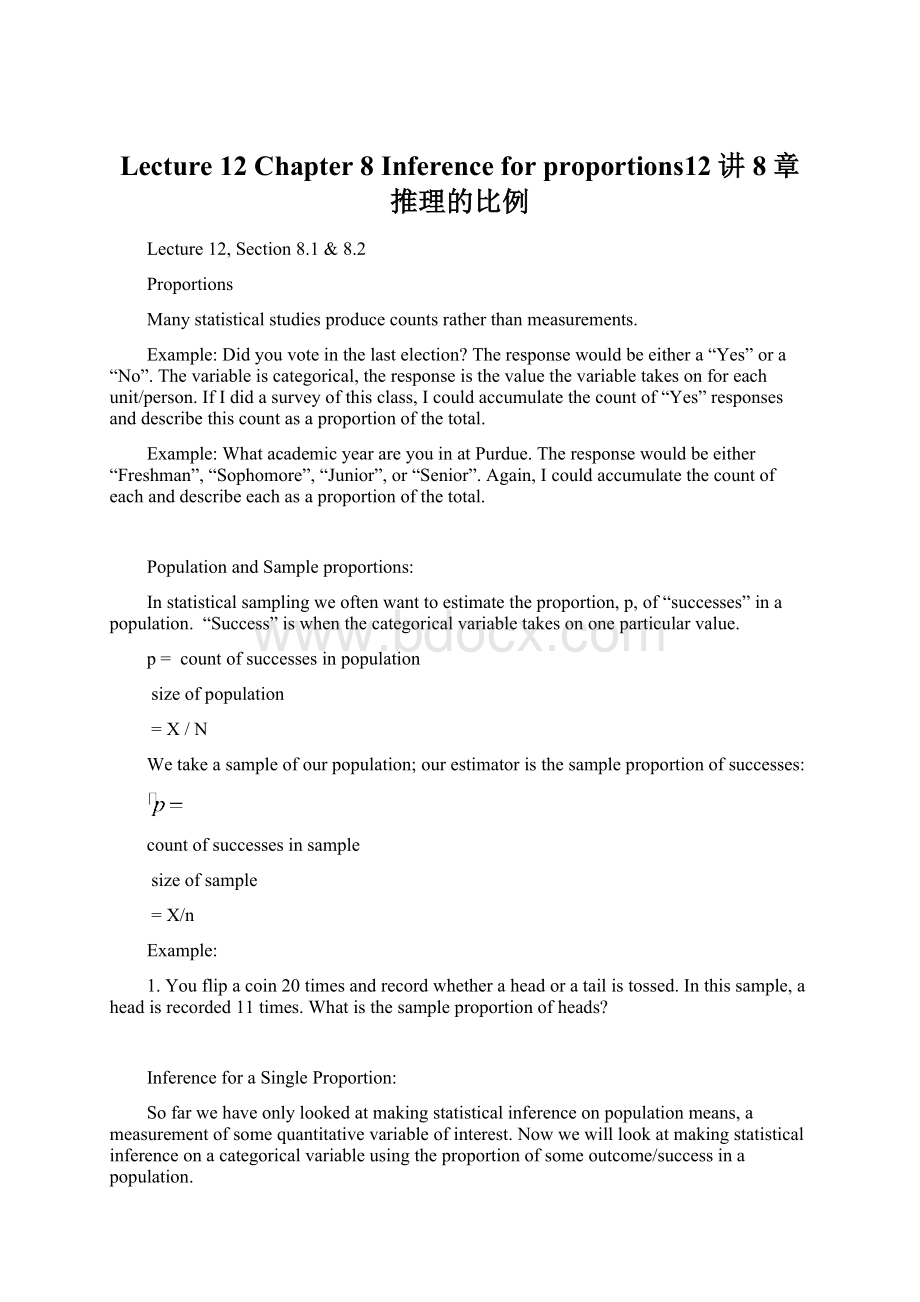
Wetakeasampleofourpopulation;ourestimatoristhesampleproportionofsuccesses:
countofsuccessesinsample
sizeofsample
=X/n
Example:
1.Youflipacoin20timesandrecordwhetheraheadoratailistossed.Inthissample,aheadisrecorded11times.Whatisthesampleproportionofheads?
InferenceforaSingleProportion:
Sofarwehaveonlylookedatmakingstatisticalinferenceonpopulationmeans,ameasurementofsomequantitativevariableofinterest.Nowwewilllookatmakingstatisticalinferenceonacategoricalvariableusingtheproportionofsomeoutcome/successinapopulation.
Examples:
∙HowcommonisitforstudentsatPurduetofailaclass?
Outofasampleof200students,50ofthemhavefailedatleastoneclass,or25%.Basedonthesedata,whatcanwesayaboutallstudentsatPurdue?
∙WhatproportionofgolfersintheUSAhavemadeatleastonehole-in-oneintheirlifetime.FromanSRSof50golfers25ofthemhadmadeahole-in-one.WhatcanwesayaboutallgolfersintheUSA?
Inbothexamplesaboveweareinterestedinestimatingtheunknownproportionpfromapopulation.Theestimateofthatpopulationparameterpisthesampleproportion
astatistic.
SamplingDistributionofaSampleProportion:
ChooseanSRSofsizenfromalargepopulationwithpopulationproportionphavingsomecharacteristicofinterest.Wenormallycallwhatevercharacteristicwearestudyinga“success.”LetXbethecountofsuccessesinthesampleand
bethesampleproportionofsuccess,
=X/n
Also:
∙Thesamplingdistributionof
isapproximatelynormalforaSRSfromalargepopulationandisclosertoanormaldistributionwhenthesamplesizenislarge.
∙Themeanofthesamplingdistributionisp.
∙Thestandarddeviationofthesamplingdistributionis
Large-SampleConfidenceIntervalforaPopulationProportion:
ChooseanSRSofsizenfromalargepopulationwithunknownproportionpofsuccesses.Thesampleproportionis:
=X/n
Thestandarderrorof
is:
Whennislarge,anapproximatelevelCconfidenceintervalforpis:
where
isthevalueforthestandardnormaldensitycurvewithareaCbetween
and
.Themarginoferroris:
Usethisintervalwhenthenumberofsuccessesandthenumberoffailuresarebothatleast15andtheconfidencelevelis90%,95%,or99%.
Example:
1.Whentryingtohiremanagersandexecutives,companiessometimesverifytheacademiccredentialsdescribedbytheapplicants.Onecompanythatperformsthesecheckssummarizeditsfindingsforasix-monthperiod.Ofthe84applicantswhosecredentialswerechecked,15liedabouthavingadegree.
a.Givetheestimateoftheproportionofapplicantswholiedabouthavingadegreeandgivetheestimateforthestandarderrorof
.
b.Considerthesedatatobearandomsampleofcredentialsfromalargecollectionofsimilarapplicants.Givea95%confidenceintervalforthetrueproportionofapplicantswholieabouthavingadegree.
Large-SampleSignificanceTestforaPopulationProportion:
1.StatetheNullandAlternativehypothesis.
or
or
2.Findtheteststatistic:
DrawaSRSofsizenfromalargepopulationwithunknownproportionpofsuccesses.Totestthehypothesis,computethezstatistic:
3.Calculatethep-value.
IntermsofastandardnormalrandomvariableZ,theapproximateP-valueforatestof
against
is
is
is
4.Statetheconclusionsintermsoftheproblem.Chooseasignificancelevelsuchasα=0.05,thencomparetheP-valuetotheαlevel.
IfP-value
α,thenreject
IfP-value>α,thenfailtoreject
UsetheLarge-SampleSignificanceTestforaPopulationProportioniftheexpectednumberofsuccesses
andtheexpectednumberoffailures
arebothgreaterthan10.Ifthisisnotmet,orifthepopulationislessthan10timesaslargeasthesample,otherproceduresshouldbeused.
Example:
1.Shereka,astartingplayerforamajorcollegebasketballteam,made60%ofherfreethrowsinherlastthreeseasons.Duringthesummersheworkedhardondevelopingasoftershotinthehopeofimprovingherfree-throwaccuracy.InthefirstninegamesofthisseasonSherekamade48freethrowsin67attempts.Letpbeherprobabilityofsuccess,makingeachfreethrowsheshoots.
a.Statethenullhypothesis
thatShereka’sfree-throwprobabilityhasremainedthesameasthelastthreeseasonsandthealternative
thatherworkinthesummerresultedinahigherprobabilityofsuccess.
b.Calculatethezstatisticfortesting
versus
.
c.Doyouacceptorreject
forα=0.05?
FindtheP-value.
d.Givea90%confidenceintervalforShereka’sfree-throwsuccessprobabilityforthenewseason.Areyouconvincedthatsheisnowabetterfree-throwershooter?
e.Whatassumptionsareneededforthevalidityofthetestandconfidenceintervalcalculationsthatyouperformed?
SampleSizeforDesiredMarginofError:
ThelevelCconfidenceintervalforaproportionpwillhaveamarginoferrorapproximatelyequaltoaspecifiedvaluemwhenthesamplesizesatisfies
Herez*isthecriticalvalueforconfidenceC,andp*isanestimatedorguessedvaluefortheproportionofsuccessesinthefuturesample.Theestimatedvaluecanbeeitherbasedonapreviouspilotstudyoritcanbeassumedtobe.5,thevalueofp*thatgeneratesthelargestsamplesize.Themarginoferrorwillbelessthanorequaltomifp*ischosentobe0.5.Thesamplesizerequiredisthengivenby
Example:
1.Youwanttoestimatetheproportionofstudentsatyourcollegeoruniversitywhoareemployedfor10ormorehoursperweekwhileclassesareinsession.Youplantopresentyourresultsbya95%confidenceinterval.Usingtheestimatedvalue
findthesamplesizerequirediftheintervalistohaveanapproximatemarginoferrorof
.
ComparingTwoProportions
AssumptionsforcomparingtwoProportions:
∙ThedataconsistofthetwoindependentSRS’s
∙ThetwoSRS’sarelarge.
Typicallywewanttocomparetwoproportionsbygivingaconfidenceintervalforthedifference,
orbytestingthehypothesisofnodifference,
.
ConfidenceIntervalsforComparingTwoProportions
ChooseanSRSofsize
fromalargepopulationhavingproportion
ofsuccesses;chooseaSRSofsize
fromanotherlargepopulationhavingproportion
ofsuccess.
AnapproximatelevelCconfidenceintervalfor
is
Where
and
aretheestimatesofthepopulationproportions;thestandarderrorofthedifferenceis
andz*isthevalueforthestandardNormaldensitycurvewithareaCbetween–z*andz*.Themarginoferroris:
Usethismethodwhenthenumberofsuccessesandthenumberoffailuresinbothsamplesizesareatleast10andtheconfidencelevelis90%,95%,or99%.
Example
1.Islyingaboutcredentialsbyjobapplicantschanging?
Fromapreviousexample,onecompanythatperformsthesecheckssummarizeditsfindingsforthefirstsix-monthperiod:
ofthe84applicantswhosecredentialswerechecked,15liedabouthavingadegree.Thecompanyperformedthesamechecksforasecondperiod,theresultsforbothareshownbelow.
Period
n
X(lied)
1
84
15
2
106
35
a)Findthe95%confidenceintervalforthedifferenceoftheproportionofapplicantswholiedabouthavingadegreeforthetwoperiods.
b)Basedonthisconfidenceinterval,whatcanyousayaboutthechangeovertimeoftheproportionofapplicantsthatliedontheirapplicationforthetwoperiods?
SignificanceTestsforComparingTwoProportions
1.StatetheNullandAlternativehypothesis.
or
or
2.Findtheteststatistic:
DrawaSRSofsizenfromalargepopulationwithunknownproportionpofsuccesses.Totestthehypothesis,computethezstatistic:
where
and
andwherethepooledstandarderroris
andwhere
3.Calculatethep-value.
IntermsofastandardnormalrandomvariableZ,theapproximateP-valueforatestof
against
is
is
is
4.Statetheconclusionsintermsoftheproblem.Chooseasignificancelevelsuchasα=0.05,thencomparetheP-valuetotheαlevel.
IfP-value
α,thenreject
IfP-value>α,thenfailtoreject
Examples
1.Dataontheproportionofapplicantswholiedabouthavingadegreeintwoconsecutivesix-monthperiodsaregiveninthepreviousexampleas:
Period
n
X(lied)
1
84
15
2
106
35
a.Formulateappropriatenullandalternativehypothesesthatcanbeaddressedwiththesedata,carryoutthesignificancetest,andsummarizetheresults.