我国科技统计数据.docx
《我国科技统计数据.docx》由会员分享,可在线阅读,更多相关《我国科技统计数据.docx(28页珍藏版)》请在冰豆网上搜索。
我国科技统计数据
中国科技统计数据(2010)
1 科学研究与试验发展经费
R&DExpenditure
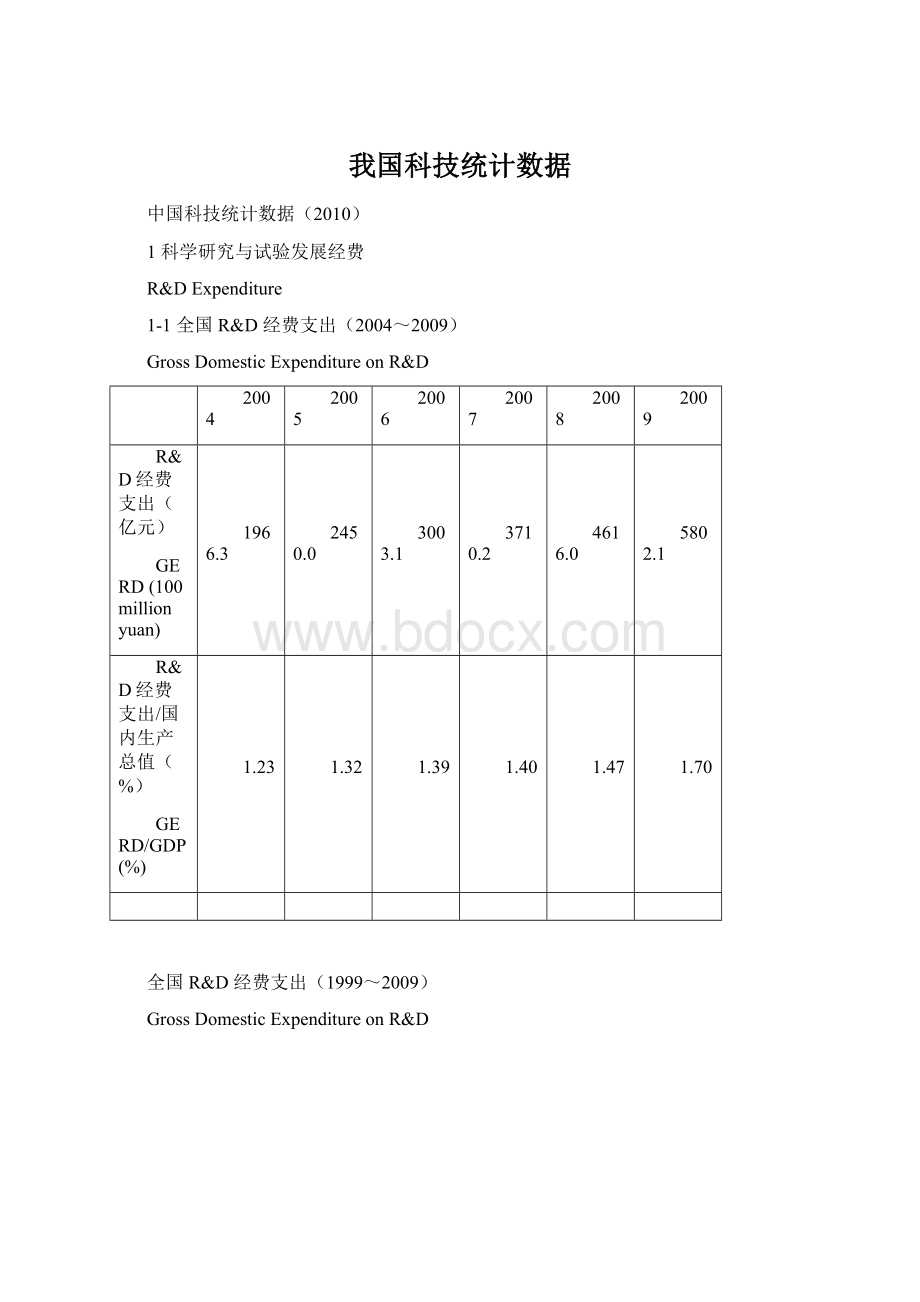
1-1 全国 R&D 经费支出(2004~2009)
GrossDomesticExpenditureonR&D
2004
2005
2006
2007
2008
2009
R&D经费支出(亿元)
GERD(100millionyuan)
1966.3
2450.0
3003.1
3710.2
4616.0
5802.1
R&D经费支出/国内生产总值(%)
GERD/GDP(%)
1.23
1.32
1.39
1.40
1.47
1.70
全国 R&D 经费支出(1999~2009)
GrossDomesticExpenditureonR&D
1-2 全国 R&D 经费支出按来源和执行部门分(2009)
GERDbysourceoffundsandsectorofperformance
亿元 100millionyuan
执行部门Performancesectors
经费来源
Sourceoffunds
合计
Total
企业
Business
研究机构
Research
institutes
高等学校
Higher
education
其他事业
单位
Others
合计
Total
5802.1
4248.6
995.9
468.2
89.4
企业
Business
4162.7
3944.9
29.8
171.7
16.3
政府
Government
1358.3
183.9
849.5
262.2
62.6
国外
Abroad
78.1
68.7
4.2
4.8
0.5
其他
Others
203.0
51.1
112.4
29.5
9.9
全国 R&D 经费支出按来源和执行部门分(2009)
GERDbysourceoffundsandbysectorofperformance
按经费来源分 Bysourceoffunds 按执行部门分 Bysectorofperformance
1-3 全国 R&D 经费支出按活动类型分(2009)
GERDbytypeofactivity
1-4 高技术产业 R&D 经费支出及其与工业总产值之比(2009)
High-technologyindustryexpenditureonR&Dandasapercentageofgrossindustrialoutput
R&D经费支出(亿元)
R&Dexpenditure
(100millionyuan)
与工业总产值之比(%)
Asapercentageof
grossindustrialoutput
全部高技术产业
High-technologyindustries
892.1
1.48
航空航天器制造业
Aircraftandspacecraft
66.3
4.90
电子计算机及办公设备制造业
Computersandofficeequipments
104.8
0.64
电子及通信设备制造业
Electronicandtelecommunication
equipments
501.2
1.73
医疗设备及仪器仪表制造业
Medicalequipmentsandmeters
85.4
1.94
医药制造业
Pharmaceuticals
134.5
1.42
高技术产业R&D经费支出及其与工业总产值之比(2009)
High-technologyindustryexpenditureonR&Dandasapercentageofgrossindustrialoutput
1-5 全国 R&D 经费支出按地域分(2009)
GERDbyregion
亿元 100millionyuan
地区 Region
R&D经费支出
R&Dexpenditure
地区 Region
R&D经费支出
R&Dexpenditure
合计 Total
5802.1
北京 Beijing
668.6
上海 Shanghai
423.4
天津 Tianjin
178.5
江苏 Jiangsu
702.0
河北 Hebei
134.8
浙江 Zhejiang
398.8
山西 Shanxi
80.9
安徽 Anhui
136.0
内蒙古 InnerMongolia
52.1
福建 Fujian
135.4
辽宁 Liaoning
232.4
江西 Jiangxi
75.9
吉林 Jilin
81.4
山东 Shandong
519.6
黑龙江 Heilongjiang
109.2
河南 Henan
174.8
湖北 Hubei
213.4
云南 Yunnan
37.2
湖南 Hunan
153.5
西藏
Tibet1.4
广东 Guangdong
653.0
陕西 Shaanxi
189.5
广西 Guangxi
47.2
甘肃 Gansu
37.3
海南 Hainan
5.8
青海 Qinghai
7.6
重庆 Chongqing
79.5
宁夏 Ningxia
10.4
四川 Sichuan
214.5
新疆 Xinjiang
21.8
贵州Guizhou
26.4
2 财政科技拨款
GovernmentS&TAppropriation
2-1 国家财政科技拨款(2004~2009)
GovernmentS&Tappropriation
2004
2005
2006
2007
2008
2009
国家财政科技拨款(亿元)
GovernmentS&Tappropriation
(100millionyuan)
1095.3
1334.9
1688.5
2113.5
2581.8
3224.9
与国家财政总支出的比值(%)
Shareintotalgovernmentexpenditure(%)
3.84
3.93
4.18
4.25
4.12
4.23
注:
2007年政府收支分类体系改革后,财政科技支出包括“科学技术”科目下支出和其他功能支出中用于科学技术的支出;前后年度财政科技支出涵盖范围基本一致,但分项数据不具有可比性。
Note:
Theclassificationsofrevenueandexpenditureaccountshavebeenadjustedlargelyin2007.GovernmentS&Tappropriationincludesboththeitemof“expenditureforscienceandtechnology”andS&Texpenditureinotheritems.
国家财政科技拨款(1999~2009)
GovernmentS&Tappropriation
2-2 中央和地方财政科技拨款(1999~2009)
CentralandlocalgovernmentS&Tappropriation
2-3 地方财政科技拨款(2009)
LocalgovernmentS&Tappropriationbyregion
百万元 millionyuan
地区 Region
A
B(%)
地区 Region
A
B(%)
合计 Total
131070
2.15
北京 Beijing
12631
5.45
上海 Shanghai
21531
7.20
天津 Tianjin
3400
3.02
江苏 Jiangsu
11702
2.91
河北 Hebei
2643
1.13
浙江 Zhejiang
9930
3.74
山西 Shanxi
1761
1.13
安徽 Anhui
3647
1.70
内蒙古 InnerMongolia
1807
0.94
福建 Fujian
2789
1.98
辽宁 Liaoning
5749
2.14
江西 Jiangxi
1340
0.86
吉林 Jilin
1898
1.28
山东 Shandong
6288
1.92
黑龙江 Heilongjiang
1996
1.06
河南 Henan
3552
1.22
湖北 Hubei
2533
1.21
云南 Yunnan
1899
0.97
湖南 Hunan
2962
1.34
西藏 Tibet
269
0.57
广东 Guangdong
16850
3.89
陕西 Shaanxi
2084
1.13
广西 Guangxi
1807
1.11
甘肃 Gansu
1018
0.82
海南 Hainan
607
1.25
青海 Qinghai
478
0.98
重庆 Chongqing
1555
1.20
宁夏 Ningxia
440
1.02
四川 Sichuan
2864
0.80
新疆 Xinjiang
1614
1.20
贵州 Guizhou
1427
1.04
A:
地方财政科技拨款。
A:
LocalgovernmentS&Tappropriation.
B:
地方财政科技拨款占地方财政总支出的百分比。
B:
Percentageof “A” intotallocalgovernmentexpenditure.
注:
仅为“科学技术”科目下支出。
Note:
Onlyincludetheitemof “ExpenditureforScienceandTechnology”.
数据来源:
国家统计局,《中国统计年鉴2010》。
Source:
NationalBureauofStatisticsofChina,ChinaStatisticalYearbook2010.
3 科技人力资源
HumanResourceinScienceandTechnology
3-1 全国 R&D 人员总量(2004~2009)
R&Dpersonnel
2004
2005
2006
2007
2008
2009
R&D人员(万人年)
R&Dpersonnel(10,000person-years)
115.3
136.5
150.3
173.6
196.5
229.1
每万个劳动力中R&D人员(人年)
R&Dpersonnelper10,000laborforce
(person-year)
15.00
17.53
19.20
22.08
24.80
28.71
3-2 全国 R&D 人员按执行部门和活动类型分(2009)
R&Dpersonnelbysectorofperformanceandbytypeofactivity
按执行部门分 Bysectorofperformance 按活动类型分 Bytypeofactivity
3-3 全国 R&D 人员按地域分(2009)
R&Dpersonnelbyregion
千人年 1,000person-years
地区 Region
R&D人员
R&Dpersonnel
地区 Region
R&D人员
R&Dpersonnel
合计 Total
2291.25
北京 Beijing
191.78
上海 Shanghai
132.86
天津 Tianjin
52.04
江苏 Jiangsu
273.27
河北 Hebei
56.51
浙江 Zhejiang
185.07
山西 Shanxi
47.77
安徽 Anhui
59.70
内蒙古 InnerMongolia
21.68
福建 Fujian
63.27
辽宁 Liaoning
80.93
江西 Jiangxi
33.06
吉林 Jilin
39.39
山东 Shandong
164.62
黑龙江 Heilongjiang
54.16
河南 Henan
92.57
湖北 Hubei
91.16
云南 Yunnan
21.11
湖南 Hunan
63.84
西藏 Tibet
1.33
广东 Guangdong
283.65
陕西 Shaanxi
68.04
广西 Guangxi
29.86
甘肃 Gansu
21.16
海南 Hainan
4.21
青海 Qinghai
4.60
重庆 Chongqing
35.01
宁夏 Ningxia
6.92
四川 Sichuan
85.92
新疆 Xinjiang
12.66
贵州 Guizhou
13.09
3-4 全国普通高等学校分学科学生数(2008~2009)
Nationalstudentsinregularinstitutionsofhighereducationbyfieldofstudy
千人 1,000persons
2008
2009
毕业生
Graduates
在校学生
Enrolments
毕业生
Graduates
在校学生
Enrolments
大学生数 Undergraduates
5119.5
20210.2
5311.0
21446.6
理学 Science
253.5
1157.1
266.0
1206.8
工学 Engineering
1841.9
7272.0
1918.4
7741.6
农学 Agriculture
97.7
366.8
97.4
385.4
医学 Medicine
367.5
1515.0
390.5
1652.5
管理学 Administration
988.1
3958.9
1047.1
4295.0
哲学 Philosophy
1.6
8.3
1.7
8.9
经济学 Economics
259.0
1028.3
258.3
1080.2
法学 Law
208.0
695.8
200.9
694.1
教育学 Education
348.8
1042.8
328.4
1051.1
文学 Literature
740.6
3107.6
788.7
3270.3
历史学 History
12.7
57.4
13.5
60.6
全国普通高等学校毕业生按学科分(2009)
Graduatesfromregularinstitutionsofhighereducationbyfieldofstudy
3-5 出国留学人员和学成回国人员(2004~2009)
OverseasChinesestudentsandreturnees
万人 10,000persons
2004
2005
2006
2007
2008
2009
出国留学人员 OverseasChinesestudents
11.5
11.9
13.4
14.4
18.0
22.9
学成回国人员 Returnees
2.5
3.5
4.2
4.4
6.9
10.8
4 科技产出
OutputIndicators
4-1 国家知识产权局专利申请受理量及授权量(2008~2009)
PatentapplicationsfiledandpatentsgrantedbySIPO*
件 case
2008
2009
合计
Total
国内
Domestic
国外
Foreign
合计
Total
国内
Domestic
国外
Foreign
申请量 Patentapplications
828328
717144
111184
976686
877611
99075
发明 Invention
289838
194579
95259
314573
229096
85477
实用新型 Utilitymodel
225586
223945
1641
310771
308861
1910
外观设计 Design
312904
298620
14284
351342
339654
11688
授权量 Patentsgranted
411982
352406
59576
581992
501786
80206
发明 Invention
93706
46590
47116
128489
65391
63098
实用新型 Utilitymodel
176675
175169
1506
203802
202113
1689
外观设计 Design
141601
130647
10954
249701
234282
15419
*SIPO–StateIntellectualPropertyOfficeofthePeople’sRepublicofChina.
国家知识产权局专利申请受理及授权量(1999~2009)
PatentapplicationsfiledandpatentsgrantedbySIPO
4-2 国内职务发明专利按部门分(2006~2009)
Domesticserviceinventionpatentsbysector
件 case
申请量 Patentapplications
授权量 Patentsgranted
2006
2007
2008
2009
2006
2007
2008
2009
合计 Total
81485
107664
140452
172181
18400
24488
36955
52265
大专院校 Highereducation
17312
23001
30808
37965
6198
8214
10265
14391
科研单位 Researchinstitutes
6845
9748
12435
14332
2553
3173
3945
5299
企业 Business
56455
73893
95619
118257
9433
12851
22493
32160
机关团体 Otherorganizations
873
1022
1590
1627
216
250
252
415
国内职务发明专利按部门分(2009)
Domesticserviceinventionpatentsbysector
申请量 Patentapplications 授权量 Patentsgranted
4-3 国内科技论文按机构类型分(2004~2009)
DomesticS&Tpapersbytypeofinstitution
万篇 10,000papers
2004
2005
2006
2007
2008
2009
合计 Total
31.2
35.5
40.5
46.3
47.2
52.1
高等学校 Highereducation
21.5
23.5
24.3
30.6
31.8
34.2
研究机构 Researchinstitutes
3.4
3.8
4.2
4.7
5.0
5.6
企业 Business
1.4
1.4
1.3
1.5
1.6
1.8
医疗机构 Medicalinstitution
3.6
5.2
9.1
7.6
7.1
8.7
其他 Others
1.4
1.6
1.4
1.9
1.7
1.8
4-4 国际科技论文发表数(2004~2009)
ChineseS&TpapersindexedbySCI,EIandISTP
万篇 10,000papers
2004
2005
2006
2007
2008
2009
SCI
5.7
6.8
7.1
8.9
9.6
12.0
EI
3.4
5.4
6.5
7.6
8.9
9.3
ISTP
2.0
3.1
3.6
4.3
6.5
5.2
5 高技术
HighTechnology
5-1 全国高技术产品进出口(2004~2009)
Nationalimportsandexportsofhigh-techproducts
2004
2005
2006
2007
2008
2009
高技术产品出口额(亿美元)
Exportsofhigh-techproducts(USD100million)
1653.6
2182.5
2814.5
3478.0
4156.1
3769.3
占商品出口总额的比重(%)
Shareintotalexports(%)
27.9
28.6
29.0
28.6
29.1
31.4
占工业制成品出口额的比重(%)
Shareinindustrialmanufacturedexports(%)
29.9
30.6
30.7
30.1
30.8
33.1
高技术产品进口额(亿美元)
Importsofhigh-techproducts(USD100million)
1613.4
1977.1
2473.0
2870.0
3418.2
3098.5
占商品
 升级会员
升级会员 