数据分析6.docx
《数据分析6.docx》由会员分享,可在线阅读,更多相关《数据分析6.docx(9页珍藏版)》请在冰豆网上搜索。
数据分析6
Question1
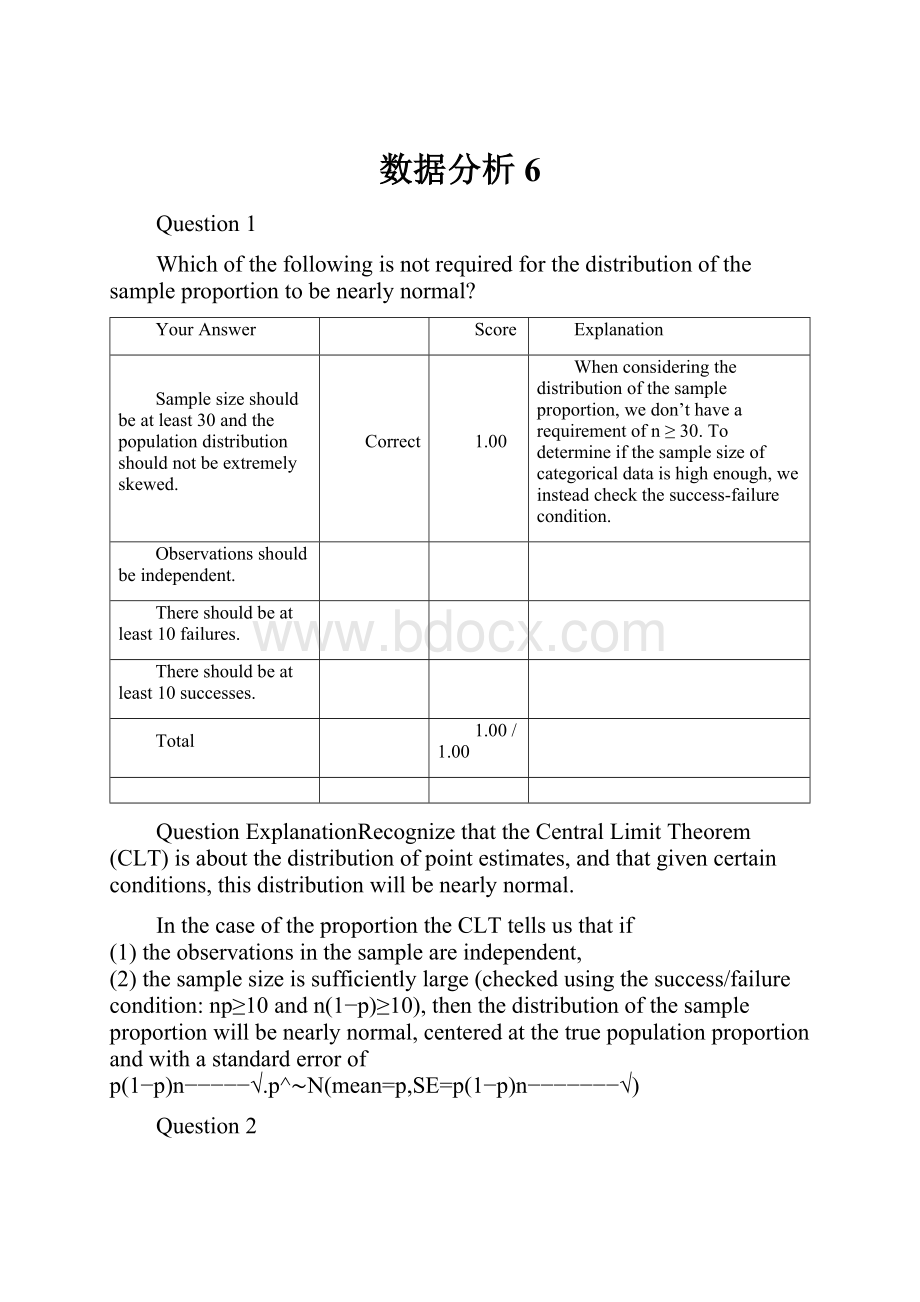
Whichofthefollowingisnotrequiredforthedistributionofthesampleproportiontobenearlynormal?
YourAnswer
Score
Explanation
Samplesizeshouldbeatleast30andthepopulationdistributionshouldnotbeextremelyskewed.
Correct
1.00
Whenconsideringthedistributionofthesampleproportion,wedon’thavearequirementofn≥30.Todetermineifthesamplesizeofcategoricaldataishighenough,weinsteadcheckthesuccess-failurecondition.
Observationsshouldbeindependent.
Thereshouldbeatleast10failures.
Thereshouldbeatleast10successes.
Total
1.00/1.00
QuestionExplanationRecognizethattheCentralLimitTheorem(CLT)isaboutthedistributionofpointestimates,andthatgivencertainconditions,thisdistributionwillbenearlynormal.
InthecaseoftheproportiontheCLTtellsusthatif
(1)theobservationsinthesampleareindependent,
(2)thesamplesizeissufficientlylarge(checkedusingthesuccess/failurecondition:
np≥10andn(1−p)≥10),thenthedistributionofthesampleproportionwillbenearlynormal,centeredatthetruepopulationproportionandwithastandarderrorofp(1−p)n−−−−−√.p^∼N(mean=p,SE=p(1−p)n−−−−−−−√)
Question2
Whencheckingconditionsforcalculatingaconfidenceintervalforaproportion,youshouldusewhichnumberofsuccessesandfailures?
YourAnswer
Score
Explanation
Dependsonthecontext
Notapplicable.Thenumberofsuccessesandfailures(observedorotherwise)isnotpartoftheconditionsrequiredforcalculatingaconfidenceintervalforaproportion.
Observed
Correct
1.00
Usetheobservednumberofsuccessesandfailureswhencalculatingaconfidenceintervalforaproportion,butnotwhendoingahypothesistest.Inahypothesistestforaproportion,youshouldusenp0andn(1−p0)successesandfailures;thatis,theexpectednumberbasedonthenullproportion.
Expected(basedonthenullvalue)
Total
1.00/1.00
QuestionExplanationForconfidenceintervalsusep^(observedsampleproportion)whencalculatingthestandarderrorandcheckingthesuccess/failurecondition.Forhypothesistestsusep0(nullvalue)whencalculatingthestandarderrorandcheckingthesuccess/failurecondition.
Question3
InMay2011,Gallupasked1,721studentsingradesfivethroughtwelveiftheirschoolteachesthemaboutmoneyandbanking.Researchersareinterestedinfindingoutifamajorityofstudentsreceivesucheducation.Whichofthefollowingisthecorrectsetofhypotheses?
YourAnswer
Score
Explanation
H0:
p^=0.5;HA:
p^≠0.5
H0:
p=0.5;HA:
p>0.5
Correct
1.00
Thewordingofthequestiontellsuswe’reinterestedinwhetherthetrueproportionofstudentsreceivingthiseducationisgreaterthan50%(i.e.makesthem“amajority”).
H0:
p<0.5;HA:
p>0.5
H0:
μ=0.5;HA:
μ>0.5
Total
1.00/1.00
QuestionExplanationThisquestionrevisitsthesetupofhypothesistestingwithinthecategoricaldata/proportionsofUnit5.
Question4
Youandafriendareabouttovisittheaviaryatthelocalzooforthefirsttime.Atrustworthyzookeepersaystheaviaryholdsabout3,000birds.Yourfriendreadsomewherethat10%ofthosebirdsarecardinals,buthethinkstherearereallymorecardinalsthanthat.You’rebothgreatatidentifyingcardinalssoyoudecidetotestthisclaimwithahypothesistestonthetrueproportionpofcardinalsintheaviary.Youwalkaroundtheaviarytogetherandgetasimplerandomsamplebyspotting250birds.Ofthese,35werecardinalsand215werenotcardinals.Thep-valueis0.0175.Whichofthefollowingisfalse?
YourAnswer
Score
Explanation
p^=0.14
H0:
p=0.10
Thesuccess-failureconditionismet.
Ifinfact10%ofthebirdsintheaviaryarecardinals,theprobabilityofobtainingarandomsampleof250birdswhereexactly14%arecardinalsis0.027.
Correct
1.00
p-value=P(observedormoreextremeteststatistic|H0true)
Total
1.00/1.00
QuestionExplanationp-value=P(observedormoreextremeteststatistic|H0true)
Question5
Whendoweusethepooledproportionincalculationofthestandarderrorofthedifferenceoftwoproportions(SE(p^1−p^2))?
YourAnswer
Score
Explanation
whenusingarandomizationtesttocomparep1−p2
whencomparingp1andp2usingatheoreticalapproach,andthenullhypothesisisH0:
p1−p2=(somevalueotherthan0)
Inorrect
0.00
Reviewtheassociatedlearningobjective.
whenconstructingaconfidenceintervalforp1−p2
whencomparingp1andp2usingatheoreticalapproach,andthenullhypothesisisH0:
p1−p2=0
Total
0.00/1.00
∙QuestionExplanationNotethatthestandarderrorcalculationfortheconfidenceintervalandthehypothesistestaredifferentwhendealingwithproportions,sinceinthehypothesistestweneedtoassumethatthenullhypothesisistrue.
∙Notethatthecalculationofthestandarderrorofthedistributionofthedifferenceintwoindependentsampleproportionsisdifferentforaconfidenceintervalandahypothesistest.
Question6
Toevaluatethefollowinghypotheses
H0:
p=0.3
HA:
p≠0.3
weusearandomsampleof50observationswherep^=0.36.Whichofthefollowingisthecorrectstandarderror?
Choosetheclosestanswer.
YourAnswer
Score
Explanation
0.0648
0.0679
Inorrect
0.00
Forahypothesistest,SE=p0(1−p0)n−−−−−−√
0.0096
0.0297
0.0042
0.0092
Total
0.00/1.00
QuestionExplanationNotethatthereasonforthedifferenceincalculationsofstandarderroristhesameasinthecaseofthesingleproportion:
whenthenullhypothesisclaimsthatthetwopopulationproportionsareequal,weneedtotakethatintoconsiderationwhencalculatingthestandarderrorforthehypothesistest,anduseacommonproportionforbothsamples.
Question7
Anintroductorystatsprofessorhypothesizesthat50%ofstudentslearnbestbywatchingthevideos,10%byreadingthebook,20%bysolvingquestions,andtherestfromthediscussionforums.Shesurveysarandomsampleofalargesampleofstudentsaskingthemhowtheylearnbest,andwantstousethesedatatoevaluateherhypothesis.Whichmethodshouldsheuse?
YourAnswer
Score
Explanation
Z-test
t-test
χ2testofgoodnessoffit
Correct
1.00
ANOVA
Total
1.00/1.00
∙QuestionExplanationUseachi-squaretestofgoodnessoffittoevaluateifthedistributionoflevelsofasinglecategoricalvariablefollowsahypothesizeddistribution.
∙Whenevaluatingtheindependenceoftwocategoricalvariableswhereatleastonehasmorethantwolevels,useachi-squaretestofindependence.
Question8
Whendoingahypothesistestonasingleproportion(i.e.foronecategoricalvariable),wehavestudiedhowtocalculatethep-valueforthehypothesistest,beginningwithgeneratingsimulatedsamples.Whichofthefollowingisthebestdescriptionforhowyoushouldgeneratethesimulatedsamples,andwhy?
YourAnswer
Score
Explanation
Generatesimulatedsamplesbasedonthealternativehypothesisbecausethatisthehypothesiswe’retryingtoprovewhendoingthehypothesistest.
Generatesimulatedsamplesbasedonthenullhypothesisbecausethatisthehypothesiswe’retryingtoprovewhendoingthehypothesistest.
Generatesimulatedsamplesbasedonthenullhypothesisbecauseweneedtoseehowextremeourobserveddatalooksifthenullhypothesiswerereallytrue.
Correct
1.00
Generatesimulatedsamplesbasedonthealternativehypothesisbecauseweneedtoseehowextremeourobserveddatalooksifthealternativehypothesiswerereallytrue.
Total
1.00/1.00
QuestionExplanationInhypothesistestingforonecategoricalvariable,generatesimulatedsamplesbasedonthenullhypothesis,andthencalculatethenumberofsamplesthatareatleastasextremeastheobserveddata.
Question9
Trueorfalse:
Incalculationoftherequiredsamplesizeforagivenmarginoferroroftheconfidenceintervalforapopulationproportion,weshouldusep^=0.5ifwedon’thaveanyknowledgeaboutthecharacteristicsofthepopulation.
YourAnswer
Score
Explanation
True
Correct
1.00
False
Total
1.00/1.00
Question10
Supposeinapopulation20%ofpeoplewearcontactlenses.Whatistheexpectedshapeofthesamplingdistributionofproportionofcontactlenswearersinrandomsamplesof30peoplefromthispopulation?
YourAnswer
Score
Explanation
right-skewed
Correct
1.00
S-Fconditionnotmet,andthetruepopulationiscloserto0than1,sothesamplingdistributionwillberightskewed.
uniform
left-skewed
nearlynormal
Total
1.00/1.00
QuestionExplanationNotethatiftheCLTdoesn'tapplyandthesampleproportionislow(closeto0)thesamplingdistributionwilllikelyberightskewed,ifthesampleproportionishigh(closeto1)thesamplingdistributionwilllikelybeleftskewed.
Question11
Atastopsign,somedriverscometoafullstop,somecometoa‘rollingstop’(notafullstop,butslowdown),andsomedonotstopatall.Wewouldliketotestifthereisanassociationbetweengenderandtypeofstop(full,rolling,ornostop).Wecollectdatabystandingafewfeetfromastopsignandtakingnoteoftypeofstopandthegenderofthedriver.Whatarethehypothesesfortestingforanassociationbetweengenderandtypeofstop?
YourAnswer
Score
Explanation
H0:
Genderandtypeofstopareindependent.
HA:
Genderandtypeofstopareassociated.
H0:
Malesandfemalesareequallylikelytocometoarollingstop.
HA:
Males
 升级会员
升级会员 