多元线性回归模型案例.docx
《多元线性回归模型案例.docx》由会员分享,可在线阅读,更多相关《多元线性回归模型案例.docx(29页珍藏版)》请在冰豆网上搜索。

多元线性回归模型案例
我国农民收入影响因素的回归分析
本文力图应用适当的多元线性回归模型,对有关农民收入的历史数据和现状进行分析,探讨影响农民收入的主要因素,并在此基础上对如何增加农民收入提出相应的政策建议。
?
农民收入水平的度量常采用人均纯收入指标。
影响农民收入增长的因素是多方面的,既有结构性矛盾因素,又有体制性障碍因素。
但可以归纳为以下几个方面:
一是农产品收购价格水平。
二是农业剩余劳动力转移水平。
三是城市化、工业化水平。
四是农业产业结构状况。
五是农业投入水平。
考虑到复杂性和可行性,所以对农业投入与农民收入,本文暂不作讨论。
因此,以全国为例,把农民收入与各影响因素关系进行线性回归分析,并建立数学模型。
一、计量经济模型分析
(一)、数据搜集
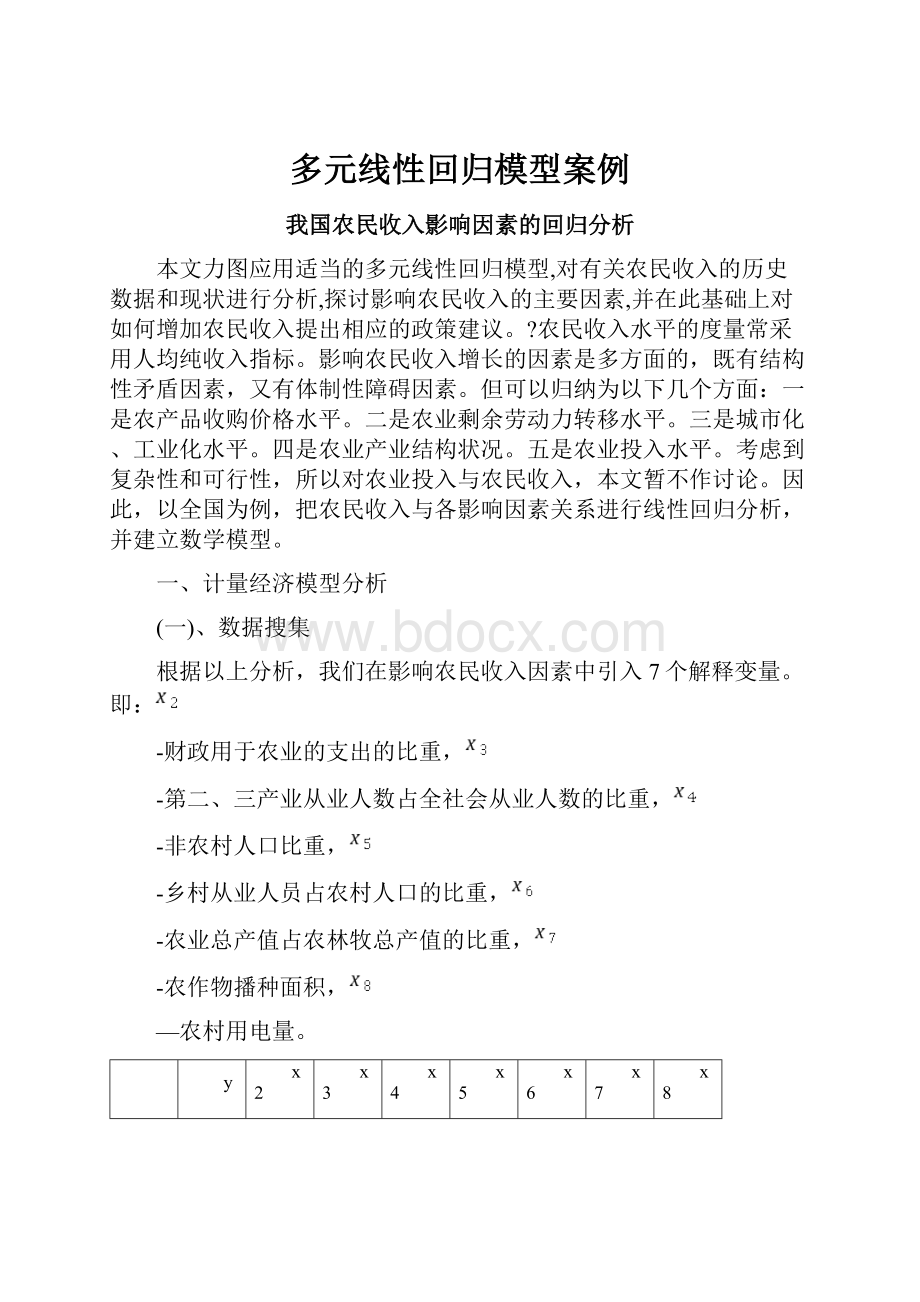
根据以上分析,我们在影响农民收入因素中引入7个解释变量。
即:
-财政用于农业的支出的比重,
-第二、三产业从业人数占全社会从业人数的比重,
-非农村人口比重,
-乡村从业人员占农村人口的比重,
-农业总产值占农林牧总产值的比重,
-农作物播种面积,
—农村用电量。
y
x2
x3
x4
x5
x6
x7
x8
年份
78年可比价
比重
%
%
比重
比重
千公顷
亿千瓦时
1986
1987
1988
1989
1990
1991
1992
1993
1994
1995
1996
1997
1998
1999
2000
2001
2002
2003
2004
2005
资料来源《中国统计年鉴2006》。
(二)、计量经济学模型建立
我们设定模型为下面所示的形式:
利用Eviews软件进行最小二乘估计,估计结果如下表所示:
DependentVariable:
Y
Method:
LeastSquares
Sample:
Includedobservations:
19
Variable
Coefficient
t-Statistic
Prob.
C
X1
X3
X4
X5
X6
X7
X8
R-squared
Meandependentvar
AdjustedR-squared
表1最小二乘估计结果
回归分析报告为:
二、计量经济学检验
(一)、多重共线性的检验及修正
①、检验多重共线性
(a)、直观法
从“表1最小二乘估计结果”中可以看出,虽然模型的整体拟合的很好,但是x4x6的t统计量并不显着,所以可能存在多重共线性。
(b)、相关系数矩阵
X2
X3
X4
X5
X6
X7
X8
X2
X3
X4
X5
X6
X7
X8
表2相关系数矩阵
从“表2相关系数矩阵”中可以看出,个个解释变量之间的相关程度较高,所以应该存在多重共线性。
②、多重共线性的修正——逐步迭代法
A、一元回归
DependentVariable:
Y
Method:
LeastSquares
Sample:
Includedobservations:
19
Variable
Coefficient
t-Statistic
Prob.
C
X2
R-squared
Meandependentvar
AdjustedR-squared
表3y对x2的回归结果
DependentVariable:
Y
Method:
LeastSquares
Sample:
Includedobservations:
19
Variable
Coefficient
t-Statistic
Prob.
C
X3
R-squared
Meandependentvar
AdjustedR-squared
表4y对x3的回归结果
DependentVariable:
Y
Method:
LeastSquares
Sample:
Includedobservations:
19
Variable
Coefficient
t-Statistic
Prob.
C
X4
R-squared
Meandependentvar
AdjustedR-squared
表5y对x4的回归结果
DependentVariable:
Y
Method:
LeastSquares
Sample:
Includedobservations:
19
Variable
Coefficient
t-Statistic
Prob.
C
X5
R-squared
Meandependentvar
AdjustedR-squared
表6y对x5的回归结果
DependentVariable:
Y
Method:
LeastSquares
Sample:
Includedobservations:
19
Variable
Coefficient
t-Statistic
Prob.
C
X6
R-squared
Meandependentvar
AdjustedR-squared
表7y对x6的回归结果
DependentVariable:
Y
Method:
LeastSquares
Sample:
Includedobservations:
19
Variable
Coefficient
t-Statistic
Prob.
C
X7
R-squared
Meandependentvar
AdjustedR-squared
表8y对x7的回归结果
DependentVariable:
Y
Method:
LeastSquares
Sample:
Includedobservations:
19
Variable
Coefficient
t-Statistic
Prob.
C
X8
R-squared
Meandependentvar
AdjustedR-squared
表9y对x8的回归结果
综合比较表3~9的回归结果,发现加入x3的回归结果最好。
以x3为基础顺次加入其他解释变量,进行二元回归,具体的回归结果如下表10~15所示:
DependentVariable:
Y
Method:
LeastSquares
Sample:
Includedobservations:
19
Variable
Coefficient
t-Statistic
Prob.
C
X3
X2
R-squared
Meandependentvar
AdjustedR-squared
表10加入x2的回归结果
DependentVariable:
Y
Method:
LeastSquares
Sample:
Includedobservations:
19
Variable
Coefficient
t-Statistic
Prob.
C
X3
X4
R-squared
Meandependentvar
AdjustedR-squared
表11加入x4的回归结果
DependentVariable:
Y
Method:
LeastSquares
Sample:
Includedobservations:
19
Variable
Coefficient
t-Statistic
Prob.
C
X3
X5
R-squared
Meandependentvar
AdjustedR-squared
表12加入x5的回归结果
DependentVariable:
Y
Method:
LeastSquares
Sample:
Includedobservations:
19
Variable
Coefficient
t-Statistic
Prob.
C
X3
X6
R-squared
Meandependentvar
AdjustedR-squared
表13加入x6的回归结果
DependentVariable:
Y
Method:
LeastSquares
Sample:
Includedobservations:
19
Variable
Coefficient
t-Statistic
Prob.
C
X3
X7
R-squared
Meandependentvar
AdjustedR-squared
表14加入x7的回归结果
DependentVariable:
Y
Method:
LeastSquares
Sample:
Includedobservations:
19
Variable
Coefficient
t-Statistic
Prob.
C
X3
X8
R-squared
Meandependentvar
AdjustedR-squared
表15加入x8的回归结果
综合表10~15所示,加入x7的模型的R最大,以x3、x7为基础顺次加入其他解释变量,进行三元回归,具体回归结果如下表16~20所示:
DependentVariable:
Y
Method:
LeastSquares
Sample:
Includedobservations:
19
Variable
Coefficient
t-Statistic
Prob.
C
X3
X7
X2
R-squared
Meandependentvar
AdjustedR-squared
表16加入x2的回归结果
DependentVariable:
Y
Method:
LeastSquares
Sample:
Includedobservations:
19
Variable
Coefficient
t-Statistic
Prob.
C
X3
X7
X4
R-squared
Meandependentvar
AdjustedR-squared
表17加入x4的回归结果
DependentVariable:
Y
Method:
LeastSquares
Sample:
Includedobservations:
19
Variable
Coefficient
t-Statistic
Prob.
C
X3
X7
X5
R-squared
Meandependentvar
AdjustedR-squared
表18加入x5的回归结果
DependentVariable:
Y
Method:
LeastSquares
Sample:
Includedobservations:
19
Variable
Coefficient
t-Statistic
Prob.
C
X3
X7
X6
R-squared
Meandependentvar
AdjustedR-squared
表19加入x6的回归结果
DependentVariable:
Y
Method:
LeastSquares
Sample:
Includedobservations:
19
Variable
Coefficient
t-Statistic
Prob.
C
X3
X7
X8
R-squared
Meandependentvar
AdjustedR-squared
表20加入x8的回归结果
综合上述表16~20的回归结果所示,其中加入x6的回归结果最好,以x3x6x7为基础一次加入其他解释变量,作四元回归估计,估计结果如表21~24所示:
DependentVariable:
Y
Method:
LeastSquares
Sample:
Includedobservations:
19
Variable
Coefficient
t-Statistic
Prob.
C
X3
X6
X7
X2
R-squared
Meandependentvar
AdjustedR-squared
表21加入x2的回归结果
DependentVariable:
Y
Method:
LeastSquares
Sample:
Includedobservations:
19
Variable
Coefficient
t-Statistic
Prob.
C
X3
X6
X7
X4
R-squared
Meandependentvar
AdjustedR-squared
表22加入x4的回归结果
DependentVariable:
Y
Method:
LeastSquares
Sample:
Includedobservations:
19
Variable
Coefficient
t-Statistic
Prob.
C
X3
X6
X7
X5
R-squared
Meandependentvar
AdjustedR-squared
表23加入x5的回归结果
DependentVariable:
Y
Method:
LeastSquares
Sample:
Includedobservations:
19
Variable
Coefficient
t-Statistic
Prob.
C
X3
X6
X7
X8
R-squared
Meandependentvar
AdjustedR-squared
表24加入x8的回归结果
综合表21~24所示的回归结果,其中加入x8的回归结果最好,以x3x6x7x8为基础顺次加入其他的解释变量,其回归结果如表25~27所示:
DependentVariable:
Y
Method:
LeastSquares
Sample:
Includedobservations:
19
Variable
Coefficient
t-Statistic
Prob.
C
X3
X6
X7
X8
X2
R-squared
Meandependentvar
AdjustedR-squared
表25加入x2的回归结果
DependentVariable:
Y
Method:
LeastSquares
Sample:
Includedobservations:
19
Variable
Coefficient
t-Statistic
Prob.
C
X3
X6
X7
X8
X5
R-squared
Meandependentvar
AdjustedR-squared
表26加入x5的回归结果
DependentVariable:
Y
Method:
LeastSquares
Sample:
Includedobservations:
19
Variable
Coefficient
t-Statistic
Prob.
C
X3
X6
X7
X8
X4
R-squared
Meandependentvar
AdjustedR-squared
表27加入x4的回归结果
据表25~27所示,分别加入x2x4x5后R均有所增加,但是参数的T检验均不显着,所以最终的计量模型如下表所示:
DependentVariable:
Y
Method:
LeastSquares
Sample:
Includedobservations:
19
Variable
Coefficient
t-Statistic
Prob.
C
X3
X6
X7
X8
R-squared
Meandependentvar
AdjustedR-squared
表28多重共线性修正后的最终模型
回归分析报告为:
(二)、异方差的检验
A、相关图形分析
图1
图2
图3
图4
从图1~4可以看出y并不随着x的增大而变得更离散,表明模型可能不存在异方差。
B、残差分析图
图5
图6
图7
图8
从图5~8看出,e2并不随x的增大而变化,表明模型可能不存在异方差。
C、ARCH检验
ARCHTest:
F-statistic
Probability
Obs*R-squared
Probability
TestEquation:
DependentVariable:
RESID^2
Method:
LeastSquares
Sample(adjusted):
Includedobservations:
16afteradjustingendpoints
Variable
Coefficient
t-Statistic
Prob.
C
RESID^2(-1)
RESID^2(-2)
RESID^2(-3)
R-squared
Meandependentvar
AdjustedR-squared
表29ARCH检验
D、Wh