《运营管理》课后习题答案.docx
《《运营管理》课后习题答案.docx》由会员分享,可在线阅读,更多相关《《运营管理》课后习题答案.docx(34页珍藏版)》请在冰豆网上搜索。
《运营管理》课后习题答案
《运营管理》课后习题答案
Chapter02-Competitiveness,Strategy,andProductivity
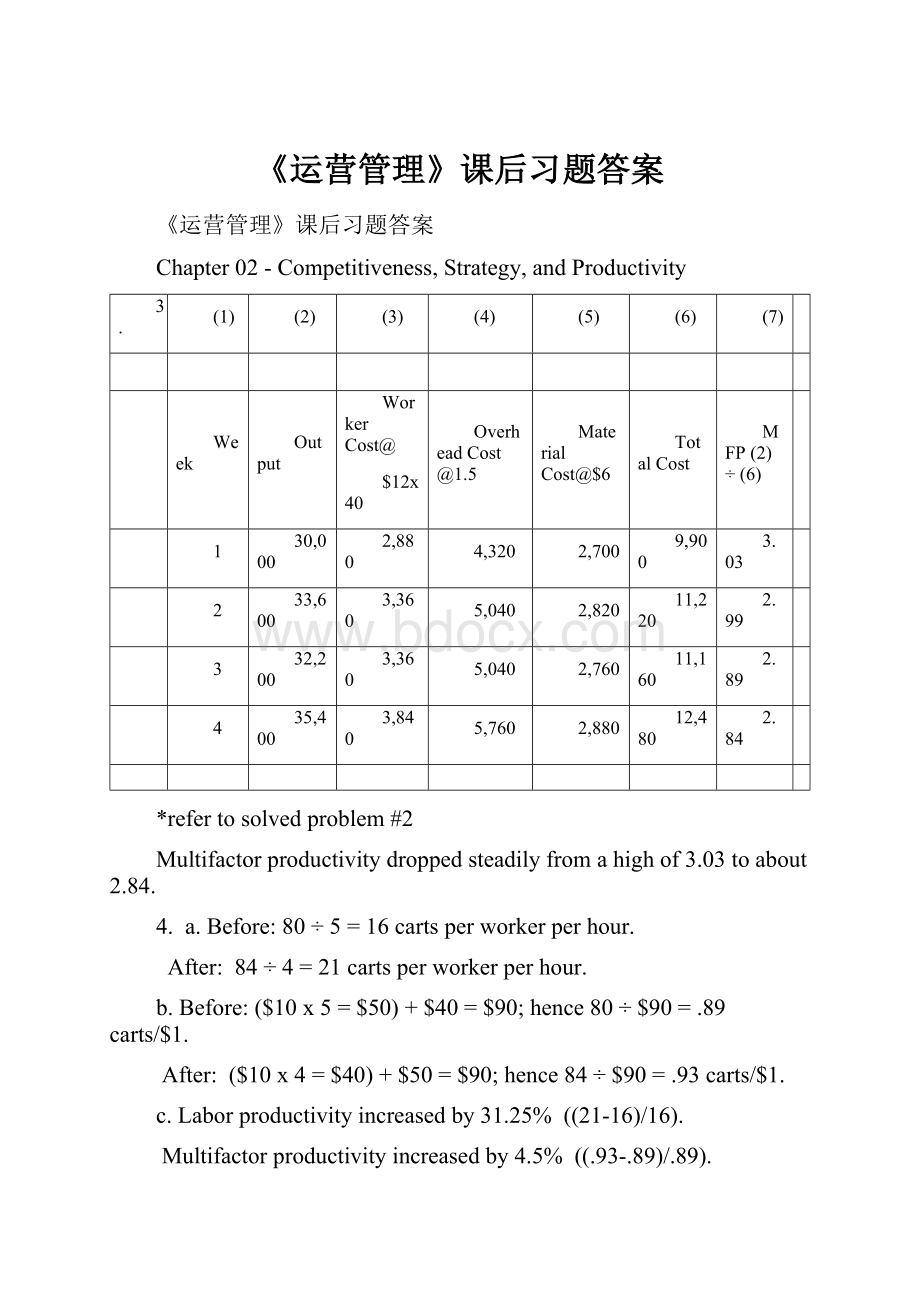
3.
(1)
(2)
(3)
(4)
(5)
(6)
(7)
Week
Output
WorkerCost@
$12x40
OverheadCost@1.5
MaterialCost@$6
TotalCost
MFP
(2)÷(6)
1
30,000
2,880
4,320
2,700
9,900
3.03
2
33,600
3,360
5,040
2,820
11,220
2.99
3
32,200
3,360
5,040
2,760
11,160
2.89
4
35,400
3,840
5,760
2,880
12,480
2.84
*refertosolvedproblem#2
Multifactorproductivitydroppedsteadilyfromahighof3.03toabout2.84.
4.a.Before:
80÷5=16cartsperworkerperhour.
After:
84÷4=21cartsperworkerperhour.
b.Before:
($10x5=$50)+$40=$90;hence80÷$90=.89carts/$1.
After:
($10x4=$40)+$50=$90;hence84÷$90=.93carts/$1.
c.Laborproductivityincreasedby31.25%((21-16)/16).
Multifactorproductivityincreasedby4.5%((.93-.89)/.89).
*MachineProductivity
Before:
80÷40=2carts/$1.
After:
84÷50=1.68carts/$1.
Productivityincreasedby-16%((1.68-2)/2)
Chapter03-ProductandServiceDesign
6.StepsforMakingCashWithdrawalfromanATM
1.InsertCard:
MagneticStripShouldbeFacingDown
2.WatchScreenforInstructions
3.SelectTransactionOptions:
1)Deposit
2)Withdrawal
3)Transfer
4)Other
4.EnterInformation:
1)PINNumber
2)SelectaTransactionandAccount
3)EnterAmountofTransaction
5.Deposit/Withdrawal:
1)Deposit—placeinanenvelope(whichyou’llfindnearorintheATM)andinsertitintothedepositslot
2)Withdrawal—liftthe“WithdrawalDoor,”beingcarefultoremoveallcash
6.Removecardandreceipt(whichservesasthetransactionrecord)
8.
Technical
Requirements
Ingredients
Handling
Preparation
CustomerRequirements
Taste
√
√
Appearance
√
√
√
Texture/consistency
√
√
Chapter04-StrategicCapacityPlanningforProductsandServices
2.
Desiredoutput=4
Operatingtime=56minutes
Task
#ofFollowingtasks
PositionalWeight
A
4
23
B
3
20
C
2
18
D
3
25
E
2
18
F
4
29
G
3
24
H
1
14
I
0
5
a.Firstrule:
mostfollowers.Secondrule:
largestpositionalweight.
AssemblyLineBalancingTable(CT=14)
WorkStation
Task
TaskTime
TimeRemaining
FeasibletasksRemaining
I
F
5
9
A,D,G
A
3
6
B,G
G
6
–
–
II
D
7
7
B,E
B
2
5
C
C
4
1
–
III
E
4
10
H
H
9
1
–
IV
I
5
9
–
b.Firstrule:
Largestpositionalweight.
AssemblyLineBalancingTable(CT=14)
WorkStation
Task
TaskTime
TimeRemaining
FeasibletasksRemaining
I
F
5
9
A,D,G
D
7
2
–
II
G
6
8
A,E
A
3
5
B,E
B
2
3
–
III
C
4
10
E
E
4
6
–
IV
H
9
5
I
I
5
–
c.
4.
a.l.
2.MinimumCt=1.3minutes
Task
Followingtasks
a
4
b
3
c
3
d
2
e
3
f
2
g
1
h
0
WorkStation
Eligible
Assign
TimeRemaining
IdleTime
I
a
A
1.1
b,c,e,(tie)
B
0.7
C
0.4
E
0.3
0.3
II
d
D
0.0
0.0
III
f,g
F
0.5
G
0.2
0.2
IV
h
H
0.1
0.1
0.6
3.
4.
b.1.
2.Assigna,b,c,d,andetostation1:
2.3minutes[noidletime]
Assignf,g,andhtostation2:
2.3minutes
3.
4.
7.
1
5
4
3
8
7
6
2
Chapter06-WorkDesignandMeasurement
3.
Element
PR
OT
NT
AFjob
ST
1
.90
.46
.414
1.15
.476
2
.85
1.505
1.280
1.15
1.472
3
1.10
.83
.913
1.15
1.050
4
1.00
1.16
1.160
1.15
1.334
Total4.332
8.
A=24+10+14=48minutesper4hours
9.
a.
Element
PR
OT
NT
A
ST
1
1.10
1.19
1.309
1.15
1.505
2
1.15
.83
.955
1.15
1.098
3
1.05
.56
.588
1.15
.676
b.
c.e=.01minutes
Chapter07-LocationPlanningandAnalysis
1.
Factor
Localbank
Steelmill
Foodwarehouse
Publicschool
1.
Convenienceforcustomers
H
L
M–H
M–H
2.
Attractivenessofbuilding
H
L
M
M–H
3.
Nearnesstorawmaterials
L
H
L
M
4.
Largeamountsofpower
L
H
L
L
5.
Pollutioncontrols
L
H
L
L
6.
Laborcostandavailability
L
M
L
L
7.
Transportationcosts
L
M–H
M–H
M
8.
Constructioncosts
M
H
M
M–H
Location(a)
Location(b)
4.
Factor
A
B
C
Weight
A
B
C
1.
BusinessServices
9
5
5
2/9
18/9
10/9
10/9
2.
CommunityServices
7
6
7
1/9
7/9
6/9
7/9
3.
RealEstateCost
3
8
7
1/9
3/9
8/9
7/9
4.
ConstructionCosts
5
6
5
2/9
10/9
12/9
10/9
5.
CostofLiving
4
7
8
1/9
4/9
7/9
8/9
6.
Taxes
5
5
5
1/9
5/9
5/9
4/9
7.
Transportation
6
7
8
1/9
6/9
7/9
8/9
Total
39
44
45
1.0
53/9
55/9
54/9
Eachfactorhasaweightof1/7.
a.
CompositeScores
39
44
45
7
7
7
BorCisthebestandAisleastdesirable.
b.
BusinessServicesandConstructionCostsbothhaveaweightof2/9;theotherfactorseachhaveaweightof1/9.
5x+2x+2x=1⇒x=1/9
c.
CompositeScores
A
B
C
53/9
55/9
54/9
BisthebestfollowedbyCandthenA.
5.
Location
x
y
A
3
7
B
8
2
C
4
6
D
4
1
E
6
4
Totals
25
20
=
∑xi
=
25
=5.0
=
∑yi
=
20
=4.0
n
5
n
5
Hence,thecenterofgravityisat(5,4)andthereforetheoptimallocation.
Chapter08-ManagementofQuality
1.
Checksheet
WorkType
Frequency
LubeandOil
12
Brakes
7
Tires
6
Battery
4
Transmission
1
Total
30
Pareto
2
.
Therunchartsseemstoshowapatternoferrorspossiblylinkedtobreaktimesortheendoftheshift.Perhapsworkersarebecomingfatigued.Ifso,perhapstwo10minutebreaksinthemorningandagainintheafternooninsteadofone20minutebreakcouldreducesomeerrors.Also,errorsareoccurringduringthelastfewminutesbeforenoonandtheendoftheshift,andthoseperiodsshouldalsobegivenmanagement’sattention.
4
Chapter9-QualityControl
4.
Sample
Mean
Range
1
79.48
2.6
MeanChart:
±A2
=79.96±0.58(1.87)
2
80.14
2.3
=79.96±1.08
3
80.14
1.2
UCL=81.04,LCL=78.88
4
79.60
1.7
RangeChart:
UCL=D4
=2.11(1.87)=3.95
5
80.02
2.0
LCL=D3
=0(1.87)=0
6
80.38
1.4
[Bothchartssuggesttheprocessisincontrol:
Neitherhasanypointsoutsidethelimits.]
6.n=200ControlLimits=
Thus,UCLis.0234andLCLbecomes0.
Sincen=200,thefractionrepresentedbyeachdatapointishalftheamountshown.E.g.,1defective=.005,2defectives=.01,etc.
Sample10istoolarge.
7.
Controllimits:
UCLis16.266,LCLbecomes0.
Allvaluesarewithinthelimits.
14.LetUSL=UpperSpecificationLimit,LSL=LowerSpecificationLimit,
=Processmean,σ=Processstandarddeviation
ForprocessH:
ForprocessK:
Assumingtheminimumacceptable
is1.33,since1.0<1.33,theprocessisnotcapable.
ForprocessT:
Since1.33=1.33,theprocessiscapable.
Chapter10-AggregatePlanningandMasterScheduling
7.a.Nobacklogsareallowed
Period
Mar.
Apr.
May
Jun.
July
Aug.
Sep.
Total
Forecast
50
44
55
60
50
40
51
350
Output
Regular
40
40
40
40
40
40
40
280
Overtime
8
8
8
8
8
3
8
51
Subcontract
2
0
3
12
2
0
0
19
Output-Forecast
0
4
–4
0
0
3
–3
Inventory
Beginning
0
0
4
0
0
0
3
Ending
0
4
0
0
0
3
0
Average
0
2
2
0
0
1.5
1.5
7
Backlog
0
0
0
0
0
0
0
0
Costs:
Regular
3,200
3,200
3,200
3,200
3,200
3,200
3,200
22,400
Overtime
960
960
960
960
960
360
960
6,120
Subcontract
280
0
420
1,680
280
0
0
2,660
Inventory
0
20
20
0
0
15
15
70
Total
4,440
4,180
4,600
5,840
4,440
3,575
4,175
31,250
b.Levelstrategy
Period
Mar.
Apr.
May
Jun.
July
Aug.
Sep.
Total
Forecast
50
44
55
60
50
40
51
350
Output
Regular
40
40
40
40
40
40
40
280
Overtime
8
8
8
8
8
8
8
56
Subcontract
2
2
2
2
2
2
2
14
Output-Forecast
0
6
–5
–10
0
10
–1
Inventory
Beginning
0
0
6
1
0
0
1
Ending
0
6
1
0
0
1
0
Average
0
3
3.5
.5
0
.5
.5
8
Backlog
0
0
0
9
9
0
0
18
Costs:
Regular
3,200
3,200
3,200
3,200
3,200
3,200
3,200
22,400
Overtime
960
960
960
960
960
960
960
6,720
Subcontract
280
280
280
280
280
280
280
1,960
Inventory
30
35
5
0
5
5
80
Backlog
180
180
360
Total
4,440
4,470
4,475
4,625
4,620
4,445
4,445
31,520
8.
Period
1
2
3
4
5
6
Total
Forecast
160
150
160
180
170
140
960
Output
Regular
150
150
150
150
160
160
920
Overtime
10
10
0
10
10
10
50
Subcontract
0
0
10
10
0
0
20
Output-Forecast
0
10
0
–10
0
0
Inventory
Beginning
0
0
10
10
0
0
Ending
 升级会员
升级会员 