剑桥雅思113小作文题目+范文汇总Word文档下载推荐.docx
《剑桥雅思113小作文题目+范文汇总Word文档下载推荐.docx》由会员分享,可在线阅读,更多相关《剑桥雅思113小作文题目+范文汇总Word文档下载推荐.docx(37页珍藏版)》请在冰豆网上搜索。
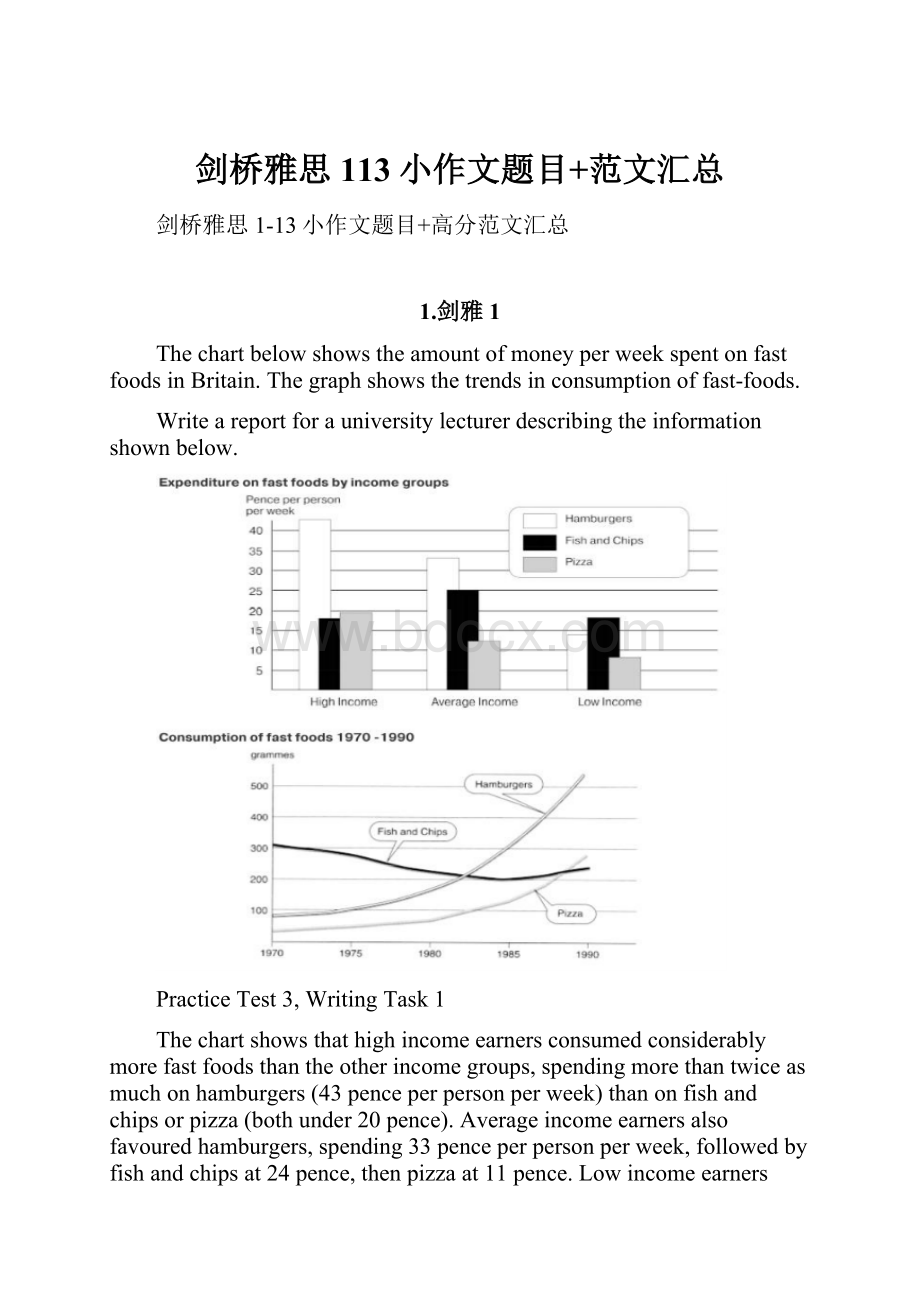
Writeareportforauniversitylecturerdescribingtheinformationshownbelow.
PracticeTest3,WritingTask1
Thechartshowsthathighincomeearnersconsumedconsiderablymorefastfoodsthantheotherincomegroups,spendingmorethantwiceasmuchonhamburgers(43penceperpersonperweek)thanonfishandchipsorpizza(bothunder20pence).Averageincomeearnersalsofavouredhamburgers,spending33penceperpersonperweek,followedbyfishandchipsat24pence,thenpizzaat11pence.Lowincomeearnersappeartospendlessthanotherincomegroupsonfastfoods,thoughfishandchipsremainstheirmostpopularfastfood,followedbyhamburgersandthenpizza.
Fromthegraphwecanseethatin1970,fishandchipsweretwiceaspopularasburgers,pizzabeingatthattimetheleastpopularfastfood.Theconsumptionofhamburgersandpizzahasrisensteadilyoverthe20yearperiodto1990whiletheconsumptionoffishandchipshasbeenindeclineoverthatsameperiodwithaslightincreaseinpopularitysince1985.(Modelanswer,165words)
2.剑雅2
Test1-Task1(Table)
Thetablebelowshowstheconsumerdurables(telephone,refrigerator,etc.)ownedinBritainfrom1972to1983.
ThechartshowsthatthepercentageofBritishhouseholdswitharangeofconsumerdurablessteadilyincreasedbetween1972and1983.Thegreatestincreasewasintelephoneownership,risingfrom42%in1972to77%in1983.Nextcamecentralheatingownership,risingfrom37%ofhouseholdsin1972to64%in1983.Thepercentageofhouseholdswitharefrigeratorrose21%overthesameperiodandofthosewithawashingmachineby14%.Householdswithvacuum-cleaners,televisionsanddishwashersincreasedby8%,5%and2%,respectively.In1983,theyearoftheirintroduction,18%ofhouseholdshadavideorecorder.
ThesignificantsocialchangesreflectedinthestatisticsarethatovertheperiodtheproportionofBritishhouseswithcentralheatingrosefromonetotwothirds,andofthosewithaphonefromunderahalftooverthree-quarters.Togetherwiththebigincreasesintheownershipofwashingmachinesandrefrigerators,theyareevidenceofbothrisinglivingstandardsandthetrendtolifestylesbasedoncomfortandconvenience.(173words,a“verygood”answer)
Test2-Task1(Barchart)
Thechartbelowshowstheamountofleisuretimeenjoyedbymenandwomenofdifferentemploymentstatus.
Thechartshowsthenumberofhoursofleisureenjoyedbymenandwomeninatypicalweekin1998-9,accordingtogenderandemploymentstatus.
Amongthoseemployedfull-time,menonaveragehadfiftyhourstoleisure,whereaswomenhadapproximatelythirty-sevenhours.Therewerenofiguresgivenformalepart-timeworkers,butfemalepart-timehadfortyhoursofleisuretime,onlyslightlymorethanwomeninfull-timeemployment,perhapsreflectingtheirworkinthehome.
Intheunemployedandretiredcategories,leisuretimeshowedanincreaseforbothsexes,asmighthavebeenexpected.Heretoo,menenjoyedmoreleisuretime—overeightyhours,comparedwithseventyhoursforwomen,perhapsonceagainreflectingthefactthatwomenspendmoretimeworkinginthehomethanmen.
Lastly,housewivesenjoyedapproximatelyfifty-fourhoursofleisure,onaverage.Therewerenofiguresgivenforhousehusbands!
Overall,thechartdemonstratesthatinthecategoriesforwhichstatisticsonmaleleisuretimewereavailable,menenjoyedatleasttenhoursofextraleisuretime.(173words,averygoodanswer)
Test3-Task1(Table)
(Band7,examiner’scomment:
Thetaskiscompetentlyreported,althoughsomedetailsareingored.Themessageisclearandthereisgooduseofcohesivedevicestoorganisepoints.Despitesomeminorerrorsinspellingandagreement,agoodrangeofstructureisused.)
剑雅2,Test4-Task1(Barchart)
Thetablebelowshowsthefiguresforimprisonmentinfivecountriesbetween1930and1980.
Thetableshowsthatfiguresforimprisonmentinthefivecountriesmentionedindicatenooverallpatternofincreaseofdecrease.Infactthereisconsiderablefluctuationfromcountrytocountry.
InGreatBritainthenumbersinprisonhaveincreasedsteadily30,000to80,000in1980.OntheotherhandinAustralia,andparticularlyinNewZealand,thenumbersfellmarkedlyfrom1930to1940.Sincethentheyhaveincreasedgradually,apartfromin1980whenthenumbersinprisoninNewZealandfellbyabout30,000fromthe1970total.Canadaistheonlycountryinwhichthenumbersinprisonhavedecreasedovertheperiod1930and1980,althoughtherehavebeenfluctuationsinthistrend.ThefiguresfortheUnitedStatesindicatethegreatestnumberofprisonerscomparedtotheotherfourcountriesbutpopulationsizeneedstobetakenintoaccountinthisanalysis.TheprisonpopulationintheUnitedStatesincreasedrapidlyfrom1970to1980andthismustbeaworryingtrend.(167words,averygoodanswer)
3.剑雅3
剑3,TEST2,task1
ThechartbelowshowstheamountspentonsixconsumergoodsinfourEuropeancountries.
范文:
ThechartshowsthatBritain,amongthefourEuropeancountrieslisted,hasspendmostheavilyontherangeofconsumergoodsincluded.Ineverycase,Britishspendingisconsiderablyhigherthanofothercountries;
onlyinthecaseoftennisracquetsdoesanothercountry,Italy,comeclose.
Incontrast,Germanyisgenerallythelowestspender.Thisismostevidentinphotographicfilm,whereGermanyspendsmuchlessthanBritish.Germanyonlyspendsmorethananothercountry,France,intwocases:
tennisracquetsandperfumes.
Meanwhile,FranceandItalygenerallymaintainmiddlepositions,averagingapproximatelysimilarspendingoverall.SpecificallyspendsmoreonCDsandphotographicfilmbutlessontennisracquetsthanItalydoes.Italy’sspendingonpersonalstereosisonlymarginallygreaterthanthatofFrance,whilespendingontoysisequalbetweenthetwo.
ItisclearfromthedatagiventhattherearesomesignificantdifferencesinspendinghabitswithinEurope.(155words,averygoodanswer)
剑3TEST3,task1
Thechartsbelowshowthelevelsofparticipationineducationandscienceindevelopingandindustrializedcountriesin1980and1990.
Thedatashowsthedifferencesbetweendevelopingandindustrializedcountries’participationineducationandscience.
Intermsofthenumberofyearsofschoolingreceived,weseethatthelengthoftimepeoplespendatschoolinindustrializedcountrieswasmuchgreaterat8.5yearsin1980,comparedto2.5yearsindevelopingcountries.Thegapwasincreasedfurtherin1990whenthefiguresroseto10.5yearsand3.5yearsrespectively.
Wecanseeasimilarpatterninthesecondgraph,whichshowsthatthenumberofpeopleworkingasscientistsandtechniciansinindustrializedcountriesincreasedfrom55to85per1,000peoplebetween1980and1990,whilethenumberindevelopingcountrieswentfrom12to20.
Finally,thefiguresforspendingonresearchanddevelopmentshowthatindustrializedcountriesmorethandoubledtheirspending,from$200bnto$420bn,whereasdevelopingcountriesactuallydecreasedtheirs,from$750bndownto$25bn.
Overallwecanseethatnotonlyarethereverylargedifferencesbetweenthetwoeconomiesbutthatthesegapsarewidening.(176words,verygoodanswer)
剑雅3,test4,task1
WRITINGTASK1
Youshouldspendabout20minutesonthistask.
ThegraphbelowshowstheunemploymentratesintheUSandJapanbetweenMarch1993andMarch1999.
Accordingtotheresultsofthelabour-forceresearchpublishedrecently,thefollowingconclusionscanbedrawnfromit:
InMarch,1993,UnitedStateshadsevenpercentoftheirworkforcewhichmightnotseemdisastrousuntilcomparedwithJapan,where2.5%wereunemployed.However,theunemploymentrateinUnitedStatesbegandecliningslowlysinceMarch1993,andreached5%markinthemiddleof1996.Japanturnedouttobelesslucky,astheirunemploymentratedoubledinthreeyears.Fromthenon.thepercentageofunemployedworkforceinUnitedStatesremainedroughlythesame—about5%untilMarch99,althoughtherewereminorfallsandrisesintheunemploymentrate.
AsforJapan,thepercentageofunemployedfellrapidlyby0.5—0.6%afterMarch1996,butfromsummer1996andonwardsitgrewsteadilyandwithoutanyfallstoreach5.0%boundaryinMarch1999.
ThemajorconclusionthatI’vedrawnusingthegraph,isthatnumberofunemployedin
USAdecreasedbyabout2.0%inthecourseofsixyears,whileinJapanitactuallyincreasedby2.5%percent.Asaresult,inMarch99,bothJapanandUShadabout5%oftheirworkforceunemployed.
(band7.Thisisagoodaccountoftheinformationpresentedinthegraph,althoughoccasionallythe
organisationofthedataisslightlyunusual.Thewritergraspsallthekeypoints,however,andsupportsthesewithfigures,beforeprovidingasummaryofthemainpoints.Sentencestructuresaremorethanadequate,althoughthewriterhassomeproblemswiththeuseoftensesandprepositions.Thereareminorexamplesofunsuitableregiste
 升级会员
升级会员 