图表题例题Word格式文档下载.doc
《图表题例题Word格式文档下载.doc》由会员分享,可在线阅读,更多相关《图表题例题Word格式文档下载.doc(4页珍藏版)》请在冰豆网上搜索。
00to22:
00.Writeareportforauniversitylecturerdescribingtheinformationshownbelow.
Youshouldwriteatleast150words.
Sample:
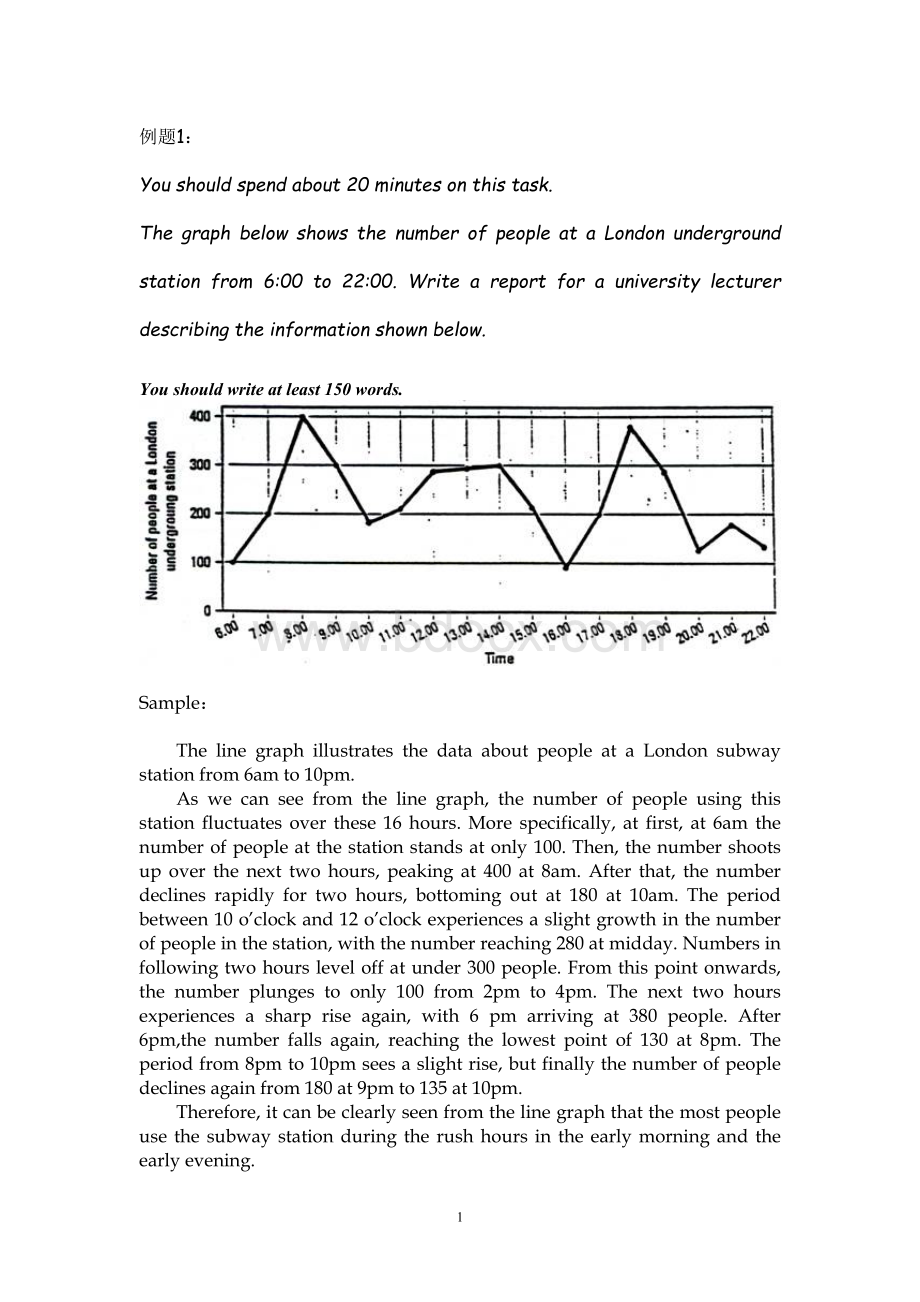
ThelinegraphillustratesthedataaboutpeopleataLondonsubwaystationfrom6amto10pm.
Aswecanseefromthelinegraph,thenumberofpeopleusingthisstationfluctuatesoverthese16hours.Morespecifically,atfirst,at6amthenumberofpeopleatthestationstandsatonly100.Then,thenumbershootsupoverthenexttwohours,peakingat400at8am.Afterthat,thenumberdeclinesrapidlyfortwohours,bottomingoutat180at10am.Theperiodbetween10o’clockand12o’clockexperiencesaslightgrowthinthenumberofpeopleinthestation,withthenumberreaching280atmidday.Numbersinfollowingtwohoursleveloffatunder300people.Fromthispointonwards,thenumberplungestoonly100from2pmto4pm.Thenexttwohoursexperiencesasharpriseagain,with6pmarrivingat380people.After6pm,thenumberfallsagain,reachingthelowestpointof130at8pm.Theperiodfrom8pmto10pmseesaslightrise,butfinallythenumberofpeopledeclinesagainfrom180at9pmto135at10pm.
Therefore,itcanbeclearlyseenfromthelinegraphthatthemostpeopleusethesubwaystationduringtherushhoursintheearlymorningandtheearlyevening.
4
例题2:
Youshouldspendabout20minutesonthistask.
ThetablebelowsummarizessomedatacollectedbyacollegebookshopforthemonthofFebruary1998.
Writeareportdescribingthesalesfiguresofvarioustypesofpublications,basedontheinformationshowninthetable.
ThetabledescribessomesalesfiguresgatheredbyacollegebookstoreforFebruary,1998.
Wecanseefromthetablethatthenon-bookclubmemberfiguresaremadeupofsalestocollegestaff,collegestudentsandmembersofthepublic.Morespecifically,collegestaffbought332magazines,44fictionand29non-fictionbookswhilecollegestudentsbought1249magazines,194non-fictionbooksand31fictionbooks.Moremagazinesweresoldtocollegestudentsthananyothergroupofcustomers.Incontrast,althoughnofictionbooksweresoldtomembersofthepublic,theybought122non-fictionbooksand82magazines.
Accordingtothetable,bookclubmembersboughtmorefiction(76)andnon-fictionbooks(942)thanothercustomers.Ontheotherhand,magazinesalestoclubmembers(33)werefewerthantoanyothertypeofcustomers.
Thetotalnumberofsalesforthemonthwas3134(1474tocollegestudents,405tostaff,204tothepublicand1051tobookclubmembers).151bookssoldwerefictionand1287werenon-fiction.Therefore,itcanbeclearlyseenfromthetablethatmagazinesaccountedforthegreatestnumberofsales(1696)
例题3:
ThediagrambelowshowshoTheAustralianBureauofMeteorologyYcollectsup-to-theminuteinformationontheweatherinordertoproducereliableforecasts.
Summarizetheinformationbyselectingandreportingthemainfeatures,andmakecomparisonswhererelevant.
Sample:
ThediagramshowsinfourstageshowtheAustralianBureauofMeterlogygetsitsweatherinformation.
Inthefirststagethereisthe“incominginformation”.Rawdataiscollectedfromouterspace,onland,oratsea,usingsatellite,radar,anddriftingbuoyrespectively.Next,thisdataisanalyzedandforecastedbyexperts.Atthisstageexpertsstudysatellitephotos,radarscreens,andsynopticchartstodetermineweatherconditions.Stagethreeoftheprocessiswhentheinformationispreparedforbroadcast.Thisisdonethroughcomputerwhichsendsallnecessarydatatothefourthstage.AtthispointtheweatherdataisbroadcastedtothegeneralpublicviaTV,radioandtelephone(recordedannouncement).
Thus,theprocessdiagramshowshowweatherdataarecollected,studied,prepared,andbroadcastedfinally.
例题4:
Thegraphbelowshowsradioandtelevisionaudiencesthroughoutthedayin1992
Summarizetheinformationbyselectingandreportingthemainfeatures,andmakecomparisonswhererelevant.
Youshouldwriteatleast150words..
ThelinegraphindicatesthedataofradioandTVaudiencesin24hours(6amto6amthenextday)in1992.
Ascanbeseenfromthelinegraph,therewasaslightriseinthenumberofaudiencesfromaround3%at6amtoabout7%at8am.Then,from8amtonoon,itremainedstable.Afterthat,thenumberofaudiencesrosesharplyuntil8pm,peakingatjustover40%.Fromthispointonwards,thenumberdeclinedfasttoaround4%at6amthenextmorning.
Then,accordingto
 升级会员
升级会员 