OFM用户操作手册中英文.docx
《OFM用户操作手册中英文.docx》由会员分享,可在线阅读,更多相关《OFM用户操作手册中英文.docx(57页珍藏版)》请在冰豆网上搜索。
OFM用户操作手册中英文
OFMUserOperationManual
OFM用户操作手册
一、CreateOFMproject建立OFM项目
Learningobjectives学习目标
(一)Thedataconnection数据的连接
(二)DataattributeDefinition数据的属性定义
(三)Thedataconnection数据的连接
Createanemptyproject建立空项目
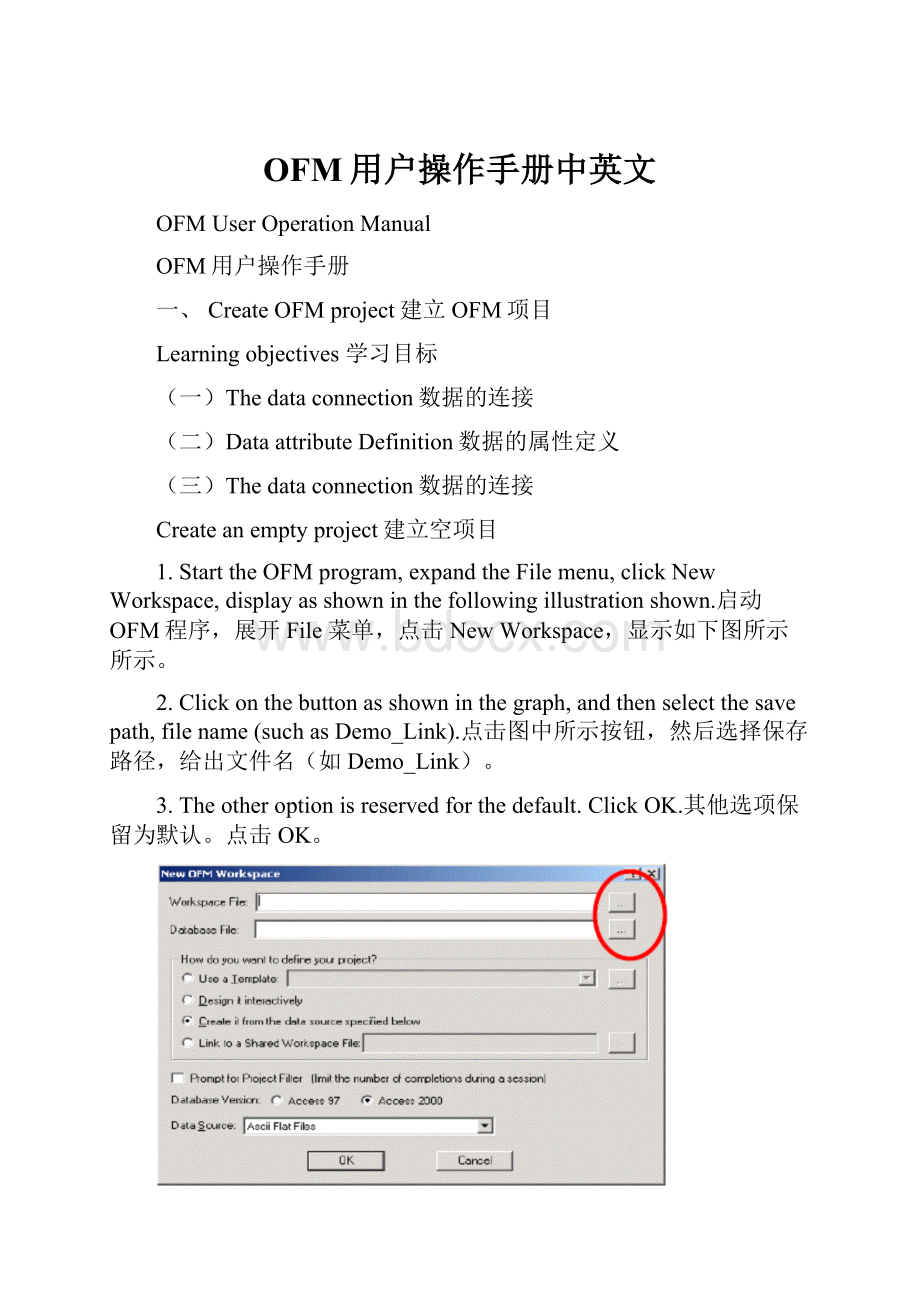
1.StarttheOFMprogram,expandtheFilemenu,clickNewWorkspace,displayasshowninthefollowingillustrationshown.启动OFM程序,展开File菜单,点击NewWorkspace,显示如下图所示所示。
2.Clickonthebuttonasshowninthegraph,andthenselectthesavepath,filename(suchasDemo_Link).点击图中所示按钮,然后选择保存路径,给出文件名(如Demo_Link)。
3.Theotheroptionisreservedforthedefault.ClickOK.其他选项保留为默认。
点击OK。
4.RightclickontheOFMRepresentationframeinHeaderId.SelectDeleteintheshortcutmenu,deletetheHeaderIdtable.右键点击OFMRepresentation框中的HeaderId。
在快捷菜单中选择Delete,删除HeaderId表。
Loadingdata加载数据
1.Doubleclick”OFM软件学习.acc”.双击”OFM软件学习.acc”。
2.Find”外部数据”》EXCEL.找到”外部数据”》EXCEL
3.FindHEADERID.XLSfile》EXCEL.找到HEADERID.XLS文件
4.Selectaprimarykeyloadingdata.选择主键加载数据。
Addthemaintable添加主表
1.ClickonthelowerrightcorneroftheAddLinkTablesbutton.点击右下角AddLinkTables按钮。
2.Findthemaintablepath,thefiletypeFilestypeis.Xls.找到主表路径,文件类型Filesoftype改为.xls。
3.SelecttheHEADERIDtable,clickOpen.选择HEADERID表格,点击Open。
4.SelecttheHEADERID$,clickOK选择HEADERID$,点击OK。
5.Clickonthefigureblock,theactivationoftheHEADERIDform.ClickOK点击如图方框,激活HEADERID表格。
点击OK。
6.Wellcoordinateloadinginfig..井位坐标加载入图。
Mapdisplaysettings底图显示设置
1.FindGridTypeinthePropertiesmenubar,andselectGridandFrame在属性菜单栏中,找到GridType,并选择GridandFrame
2.FindWellNameinthePropertiesmenubar,andselectAliasName.在属性菜单栏中,找到WellName,并选择AliasName。
3.FindLegnedinthemenubar,attributes,andselectYes.在属性菜单栏中,找到Legned,并选择Yes。
4.Mapdisplayasshowninfig..底图显示如图所示。
Loadingotherdatatable添加其他数据表
1.ClickontheSetup>Schema>Schema...点击Setup>Schema>Schema…
2.SelecttheSortCategorytable,selectStaticintheTableType.选择SortCategory表格,在TableType处选择Static。
Static---Staticdata静态数据
Monthly---Mmonthlyproductiondata月频率数据
Daily---Dailyproductiondata日频率数据
Sporadic---Sporadicdata离散数据
SporadicDualkey---SporadicDualkeydata离散双键
LookUp---LookUp查询信息
Xref---Crosscorrelationinformationdata交叉相关信息数据
4.ClickOK.Accordingtothismethod,addotherdatatable.点击OK。
按照这个方法,添加其他数据表。
Selectwellcategory井别的选择
1.ClickSetuo>Association.点击Setuo>Association。
2.SelectSortCategory.WELLTYPEintheWellType.ClickOK.(Note:
thechoiceofcoordinatesysteminXCoordinateandYCoordinateoption)在WellType处选择SortCategory.WELLTYPE。
点击OK。
(注意:
在XCoordinate和YCoordinate选项中选择坐标系统)
3.Selectusedefaultsymbol,inthewellfile,clickOK.Youcanseeintheendinthefigurelegendbecomesasshowninfigure.(Note:
ifsetuptheirownprojectshouldchooseCreatefromdata)在井号文件处选择使用默认符号,点击OK。
可以看到底图中图例变为如图所示。
(注意:
如果建立自己的项目应选择Createfromdata)
5.TakingRES_PRODtableasanexample,itrecordsthereservoirmonthlyoilproductiondata.SochooseMonthlyinTableType,IntheKeyTypeshouldbesettoCategory.
以RES_PROD表格为例,它记录了油藏的月产量。
所以在TableType处应选择Monthly。
在KeyType处应选择Category。
6.SelectRESERVOIRintheCategory.在Category处选择RESERVOIR。
7.ClickYes.点击Yes。
Dataattributedefinition数据的属性定义
1.ClickSetup>Schema>Schema..Inthetable,listmanagerleftthefindandexpandtheMonthlyprod,selectOil.RightclickontheUnitspage,settheOilfieldofthedataintheMonthlyprodtableoftheunit,andtheprovisionsoftheinputandoutputunits(metricorimperial).Setasshowninfigure.
点击Database>SchemaTables…,在表格管理器左侧的列表中找到并展开Monthlyprod,选择Oil。
在右侧点击Units页面,设置Monthlyprod表格中Oil字段数据的单位,并对输入和输出单位进行规定(公制还是英制)。
设置如图。
2.ClickonthePlotpage,fillinthemonthlyproductioninCurveName,andthechangecurveoftheattributes(suchascolor,linewidthetc.).Thiscompletesthepropertiesdefinedinthisfield.Pleasefieldaccordingtotheabovemethoddefinitionneedstobedefined.点击Plot页面,在CurveName中填写月产油,并更改曲线的属性(如颜色、线宽等)。
这就完成了这一字段的属性定义。
请按照以上方法定义需要定义的字段。
二、Mapmanagement底图的管理
Learningobjectives学习目标
_wellcategorysymbol底图井类别符号
_Settheheaders设置标题
_Addacommentfile添加注释文件
_Createannotateddocuments创建注释文件
Wellcategorysymbol井类别符号
1.ClickFormat>Symbols点击Format>Symbols。
2.InthedialogboxinNameoptions,selecttheOilProducer,intheColoroptions,selecttheRed.ClickOK.ThesamemethodwillbechangedtoyellowbrownGasProducer.在对话框中Name选项中,选择OilProducer,在Color选项中,选择Red。
点击OK。
同样的方法将GasProducer改为棕黄色。
3.Basemapchangeasshowninfigure.底图改变如图中所示。
Settheheaders设置标题
1.ClickSetup>Headers.点击Setuo>Headers。
2.ClicktheAddbutton.ThenclicktheAssistbutton.点击Add按钮。
然后点击Assist按钮。
3.Enterheadersinthetextbox,clickOK.ThenclickontheFont,modifythefontandcolor.ClickOK.在文本框中输入“Demo”点击OK。
然后点击Font,修改字体和颜色。
点击OK。
4.Theheadlinefigure.标题显示如图。
三、Thecalculatedvariable计算变量
1.ClickSetuo>CalculatedVariables.点击Setuo>CalculatedVariables。
2.ClickAddCalculatedVariables…点击AddCalculatedVariables…
3.Editcalculatedcontentsofvariables,suchaswritingMonthly.Oil+Monthly.Water.编辑计算变量的内容,如写入Monthly.Oil+Monthly.Water。
4.Theattributeisgiventocalculatethevariablename.Hefinishedwritingthecalculatedvariables给出计算变量名称的属性。
就完成了计算变量的编写(计算变量是独立的)。
5.SetvariableunitunderUnitsinterface.在Units界面下设置变量单位。
6.SetcurvepropertiesunderPlotinterface在Plot界面下设置曲线属性。
四、Report报表
Learningobjection学习目标
_singlewellreport单井报表
_Multiwellreport多井报表
_Reportoutput报表的外输
singlewellreport单井报表
1、ClickHome>Report.点击Home>Report。
2、Inthereporteditorinterfaceasshowninfigureinputcontent,clickOKcancompleteasimplereporteditor.在报表编辑界面中如图输入内容点击OK便可完成简单报表的编辑。
3、InthecolumninthePropertiesmenu,Theselectedreportrowcanchangethename,decimalplacesofdataetc..选中报表单列就可在属性菜单中更改该列的名称、数据小数位数等等。
4.InthecolumninthePropertiesmenu,selectdateformatinDataFormat.在属性菜单中,在DataFormat中选择日期格式。
5.Checkmonthlyproductionofacolumn,findSubtotalinthePropertiesmenucanbeasimplestatisticalcalculation.(containsthesum,average).ButstatisticscanbefrequencyintheBreakoptionchoice.(accordingtothemonth,quarter,year).选中月产油一列,在属性菜单中找到Subtotal可以进行简单的统计计算。
(包含求和、平均)。
而在Break选项中可以进行统计频率的选择。
(按照月、季度、年等)。
6.SelectAtConditionisintheBreakoption,ifyouchoosewillbeaconditionforeditingoptionsusedtoeditthestatisticalconditions.在Break选项中有AtCondition一个选项,如果选择就会出现一个条件编辑选项,用来编辑统计的条件。
7.SuchasthestatisticsattheyearApri.ClickOK,reportwillbestatisticsinaccordancewiththeconditions.如编写每年四月进行统计。
点击OK,报表就会按照条件进行统计。
8.Reportscanbecomplexscreening.Asshowninthegraph,canbeascreeningoutJuneandDecemberdata.报表可进行复杂的筛选。
如图中所示,可以一次筛选出来六月和十二月的数据。
Multiwellreport多井报表
1.ClickFormat>ByItem,canviewmultiplewellreport.点击Format>ByItem可以查看多井报表。
Reportoutput报表的外输
1.ThereportoutputtotheExceltable,right-clickonthereport,selectExceltheshortcutmenu.报表的输出至Excel表格中,右键点击报表,选择快捷菜单中的Excel。
2.ClickCloseandUpdate点击CloseandUpdate。
3.Excelautostartandwritestheresults.Thentheformtosave.Excel自动启动并且将结果写入。
然后将表格保存。
4.OpenagainandtransferredtotheExcelinterface,toactivatetheautomaticupdatesandusetheinterfaceoftheexistingfile.Andselectthesavedfile.ClickontheCloseandUpdate.Thenaftereachupdatestatementswillautomaticallystarttheselectedfiles,andwillfillcontentstotable.再次打开外输到Excel的界面,激活界面中的自动更新和使用已存在的文件。
并选择已保存的文件。
点击CloseandUpdate。
然后每次更新报表之后便会自动启动选择的文件,并将内容填写到选择好的表单中去。
5.ThereportoutputtotheAccessdatabase,rightclickonthereport,selectAccess.将报表外输到Access数据库中,右键点击报表,选择Access。
6.Writedowntheinputtothedatabasetablename.ClickCloseandUpdate,dataiswrittentothedatabase.写下输入到数据库中的表格名称。
点击CloseandUpdate,数据就写入数据库中了。
7.RightclickthereportalsocanchooseSendToPlotwillreportthedatadirectlyinthemap.(inthedrawinghasthesamesettingscanbesentdirectlysaiddrawingreport)报表的右键中还可以通过选择SendToPlot将报表中的数据直接成图。
(在绘图中也有同样设置可以将绘图直接发送称报表)
五、Drawing绘图
Learningobjection学习目标
_Simpledrawing简单绘图
_Multicurvedrawing多曲线绘图
_DrawingMultipictures绘制多图
_Multiaxisdiagramdrawing绘制多轴图
_Thecurvemarkup曲线的标注
Simpledrawing简单绘图
1.ClickHome>Plot.点击Home>Plot。
2.Inthisinterface,selectthedrawingvariables.在这一界面中,选择绘图中的变量。
3.Inthestepcolumnselecttargetwell.在步进栏中选择目标井。
4.Theresultsshowedasfigure.结果显示如图。
5.InthePropertiesmenuclickHeaders>Setup.Canaddthetitle.在属性菜单中点击Headers>Setup。
可以添加标题。
6.Inthetitleeditinterfacecanaddtextcaptions(e.g.,"drawing",payattentiontodoublequotationmarkscannotbeless),canalsoaddpictures,addpicturesfirstclickAssist.在标题编辑界面中可以添加文本标题(如,”绘图”,注意双引号不可少),也可添加图片,添加图片先要点击Assist。
7.InthetitleeditorinterfaceusingtheImagefunction(asshowninparentheses),thecontentisdoublequotationmarksandpicturesthefullpathandfilename.在标题编辑界面中使用Image函数。
(如图所示),括号中内容是双引号加图片全路径和文件名称。
8.Theimagesizeiscontrolledbythefont.图片大小通过字体来控制。
9.Resultsfigure.结果如图。
10.Theverticalaxisintheclickgraph,thentofindScaleTypeinthePropertiesmenu,youcanchangethecategoryintheaxistypeoptions(e.g.,linearorlogarithmic)点击图中的纵轴,然后在属性菜单中找到ScaleType,在坐标轴类型选项中可以更改类别(如,线性或对数坐标)
Multicurvedrawing绘制多曲线图
1.Doubleclickthedrawing,thedrawingappearseditinginterface,clickontheAddCurve,canaddacurve.双击绘图,出现绘图编辑界面,点击AddCurve,能够添加曲线。
2.InthePropertiesmenu,variousattributescaneditcurve(shape,fillingandsoon).在属性菜单中,可以编辑曲线的各种属性(形状、填充等等)。
3.Inthegraphicseditinginterfacecategoryoptions,canbeadifferentcategorychoice.Andthedifferentcategoriesofdatacanbedisplayedonthesamepie
 升级会员
升级会员 